

Visual analysis method for RF fingerprint based on important region localization and masking
-
摘要: 针对时域脉冲信号样本的射频指纹提取与深度学习模型的可解释性,提出了一种基于Grad-CAM的重要区域可视化呈现方法,并通过重要区域的多次掩码测试,来分析重要区域对射频指纹识别结果的影响。基于10个辐射源的信号样本,对比了层数不同的两种ResNet模型的测试结果。测试发现该方法能够区分不同类型信号并呈现个体差异。分析表明,该方法能够发现不同辐射源发送相同信号时的重要区域定位差异,能可视化反映辐射源个体特征的空间距离,以及不同模型的特征表征与指纹定位准确度差异;同时发现对重要区域的掩码更容易产生误预测,证明特定信号存在与时频特征相关的射频指纹,并可辅助可视化定位影响射频指纹样本识别的关键点。Abstract: A Grad-CAM based visualizing method for important regions is proposed for the interpretability of RF fingerprint extraction and deep learning models of time-domain pulse signal samples. The impact of important regions on RF fingerprint recognition results is analyzed through multiple mask tests of important regions. Based on signal samples of 10 emitters, the test results of two ResNet models with different layers are compared. It is found that the proposed method can distinguish different types of signals and present individual differences. Analysis shows that this method can detect important regional localization differences when different emitters send the same signal, and can visually reflect the spatial distance of RF fingerprint characteristics, as well as the differences in feature representation and fingerprint localization accuracy of different models; At the same time, it is found that masks for important areas are more prone to false predictions, which proves the existence of RF fingerprints related to time-frequency characteristics in specific signals, and can assist in visualizing key points that affect the recognition of RF fingerprint samples.
-
Key words:
- interpretability /
- radio frequency fingerprint /
- deep learning /
- visualization /
- signal characteristics
-
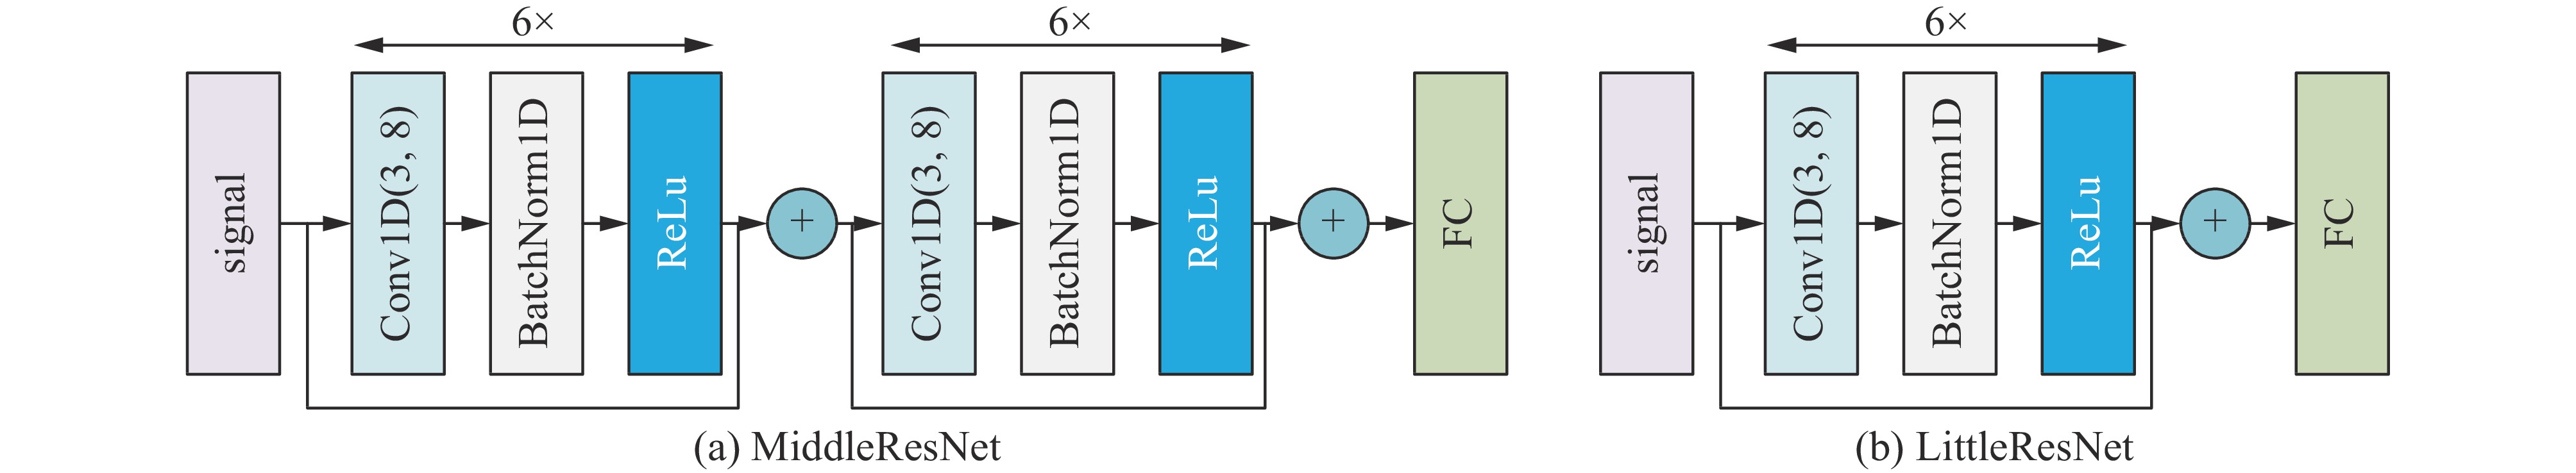
图 1 LittleResNet与MiddleResNet网络结构
Figure 1. Network architecture of MiddleResNet and LittleResNet
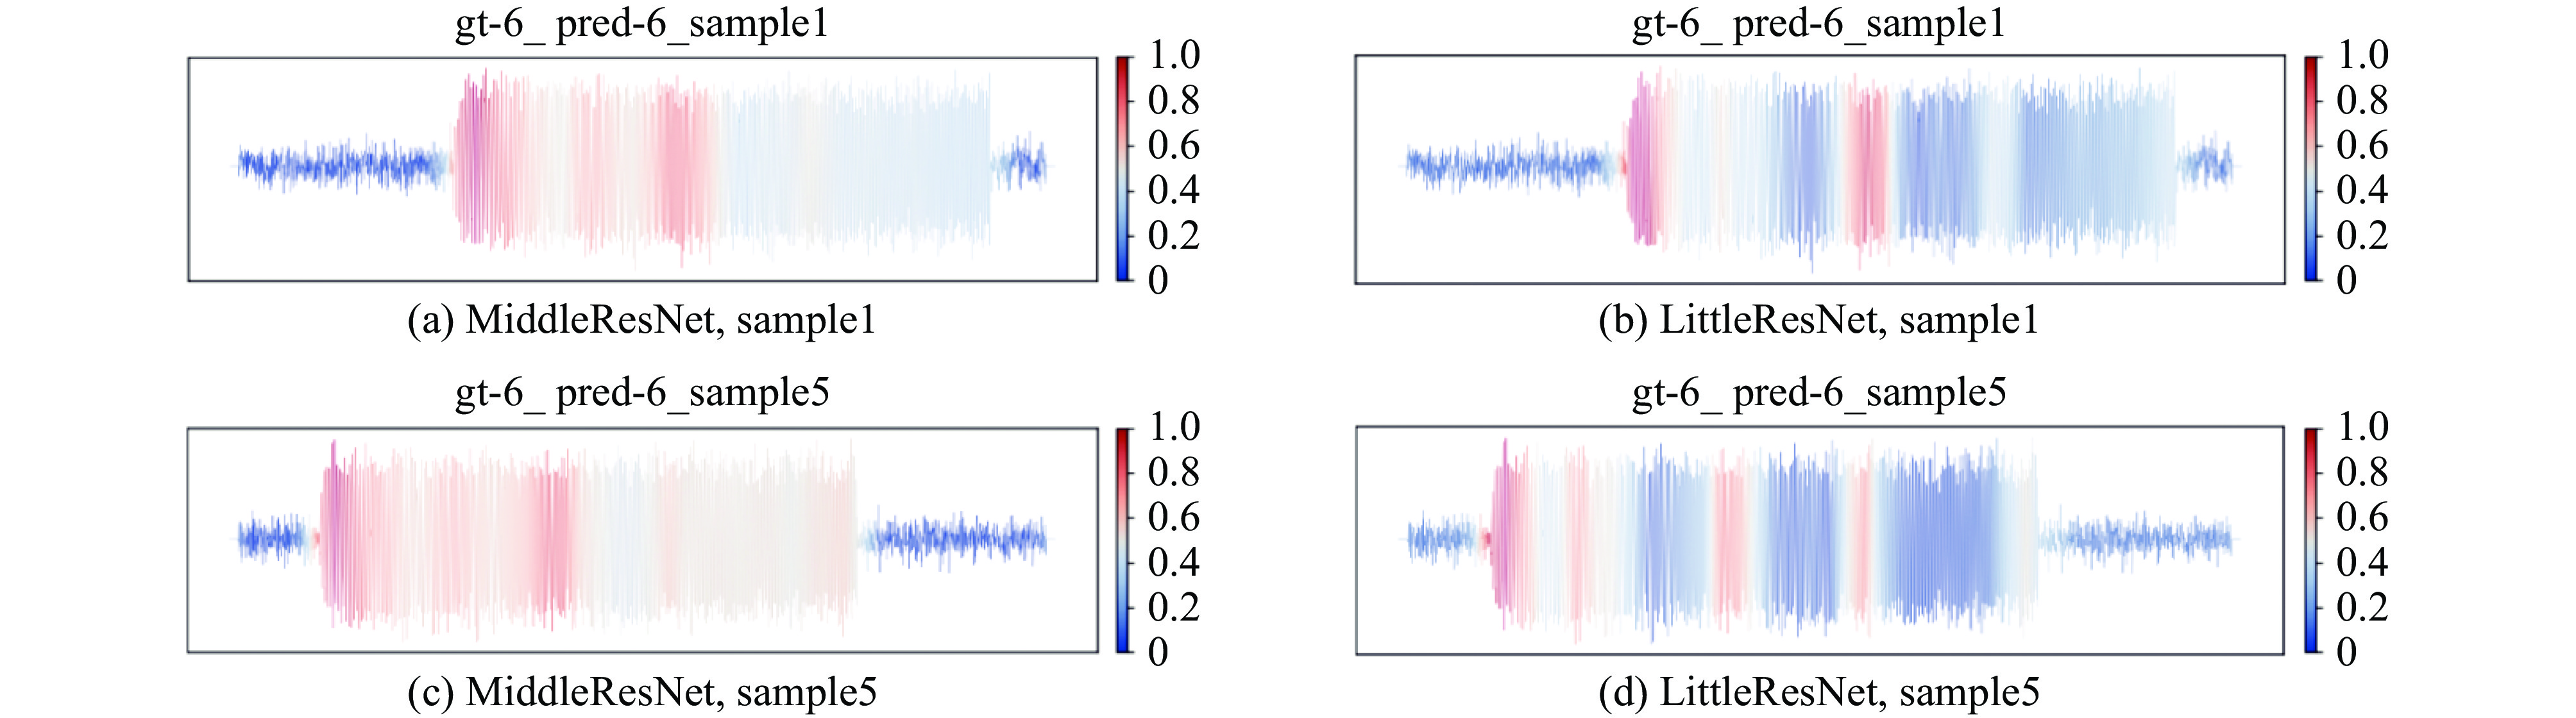
图 2 两种模型的时域脉冲信号热力图对比
Figure 2. Comparison of time-domain pulse signal heat maps between MiddleResNet and LittleResNet
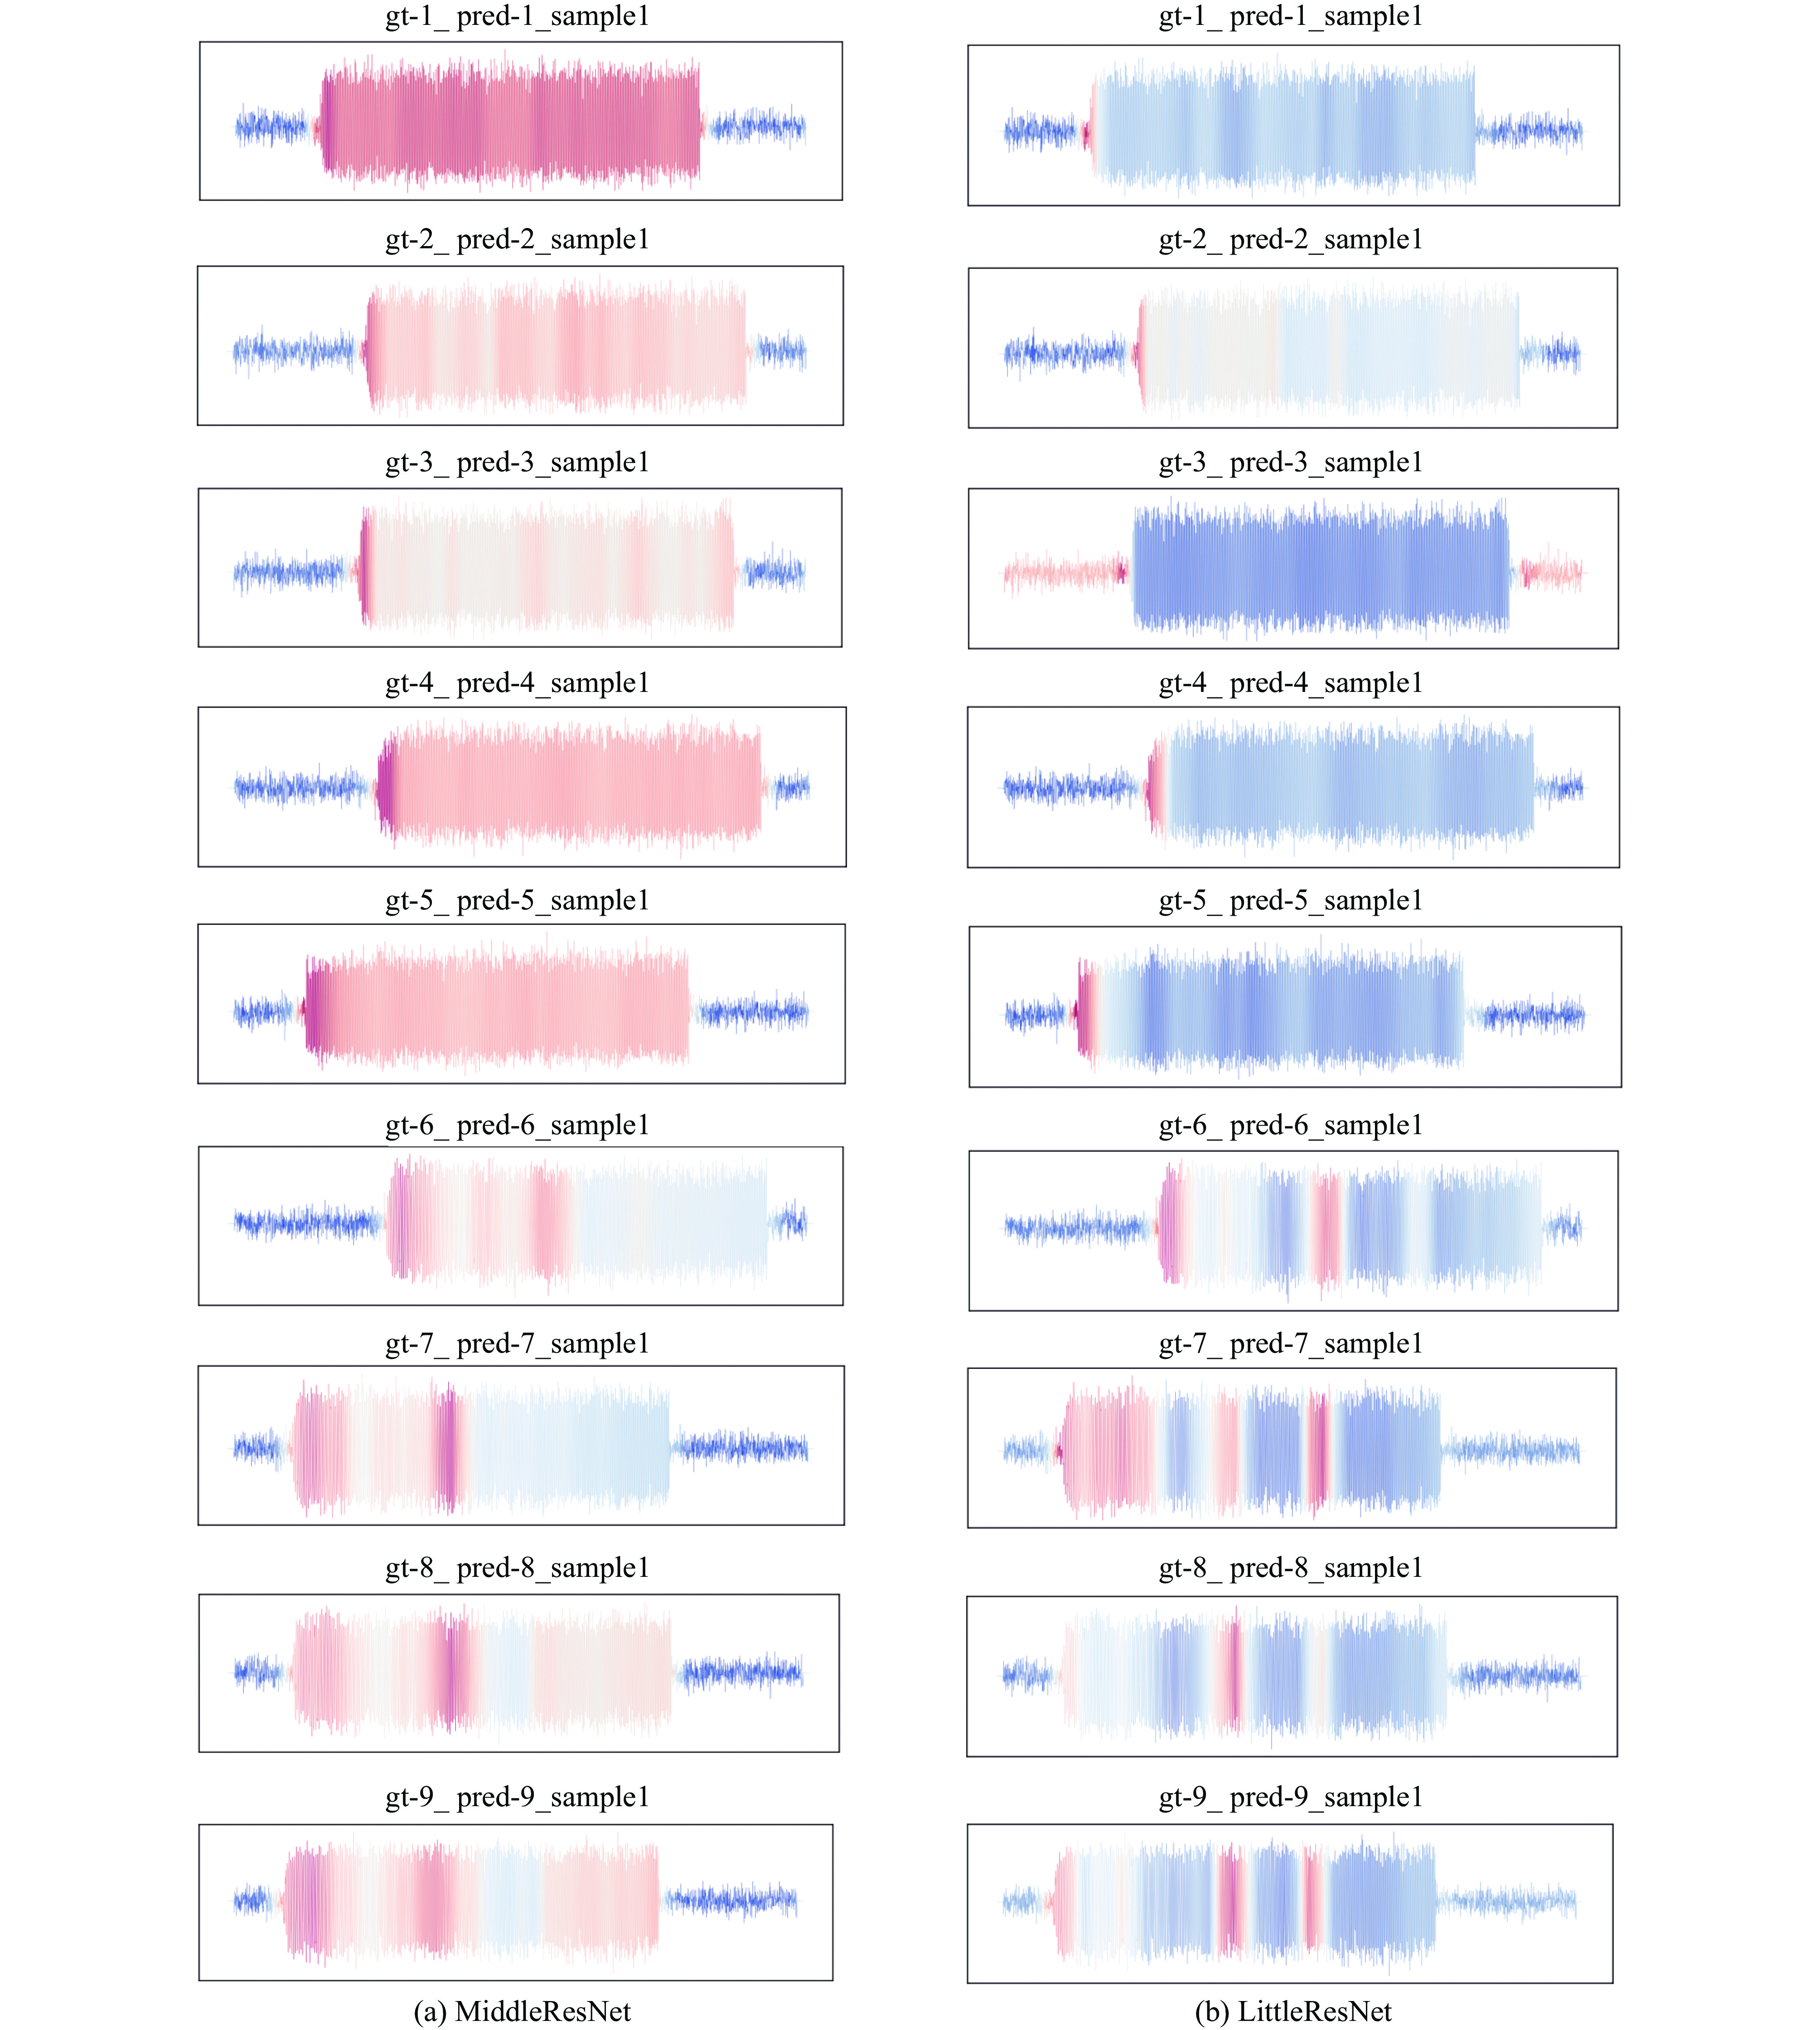
图 3 MiddleResNet模型和LittleResNet模型的各对象的重要区域呈现
Figure 3. Important areas of emitters when using MiddleResNe and LittleResNet
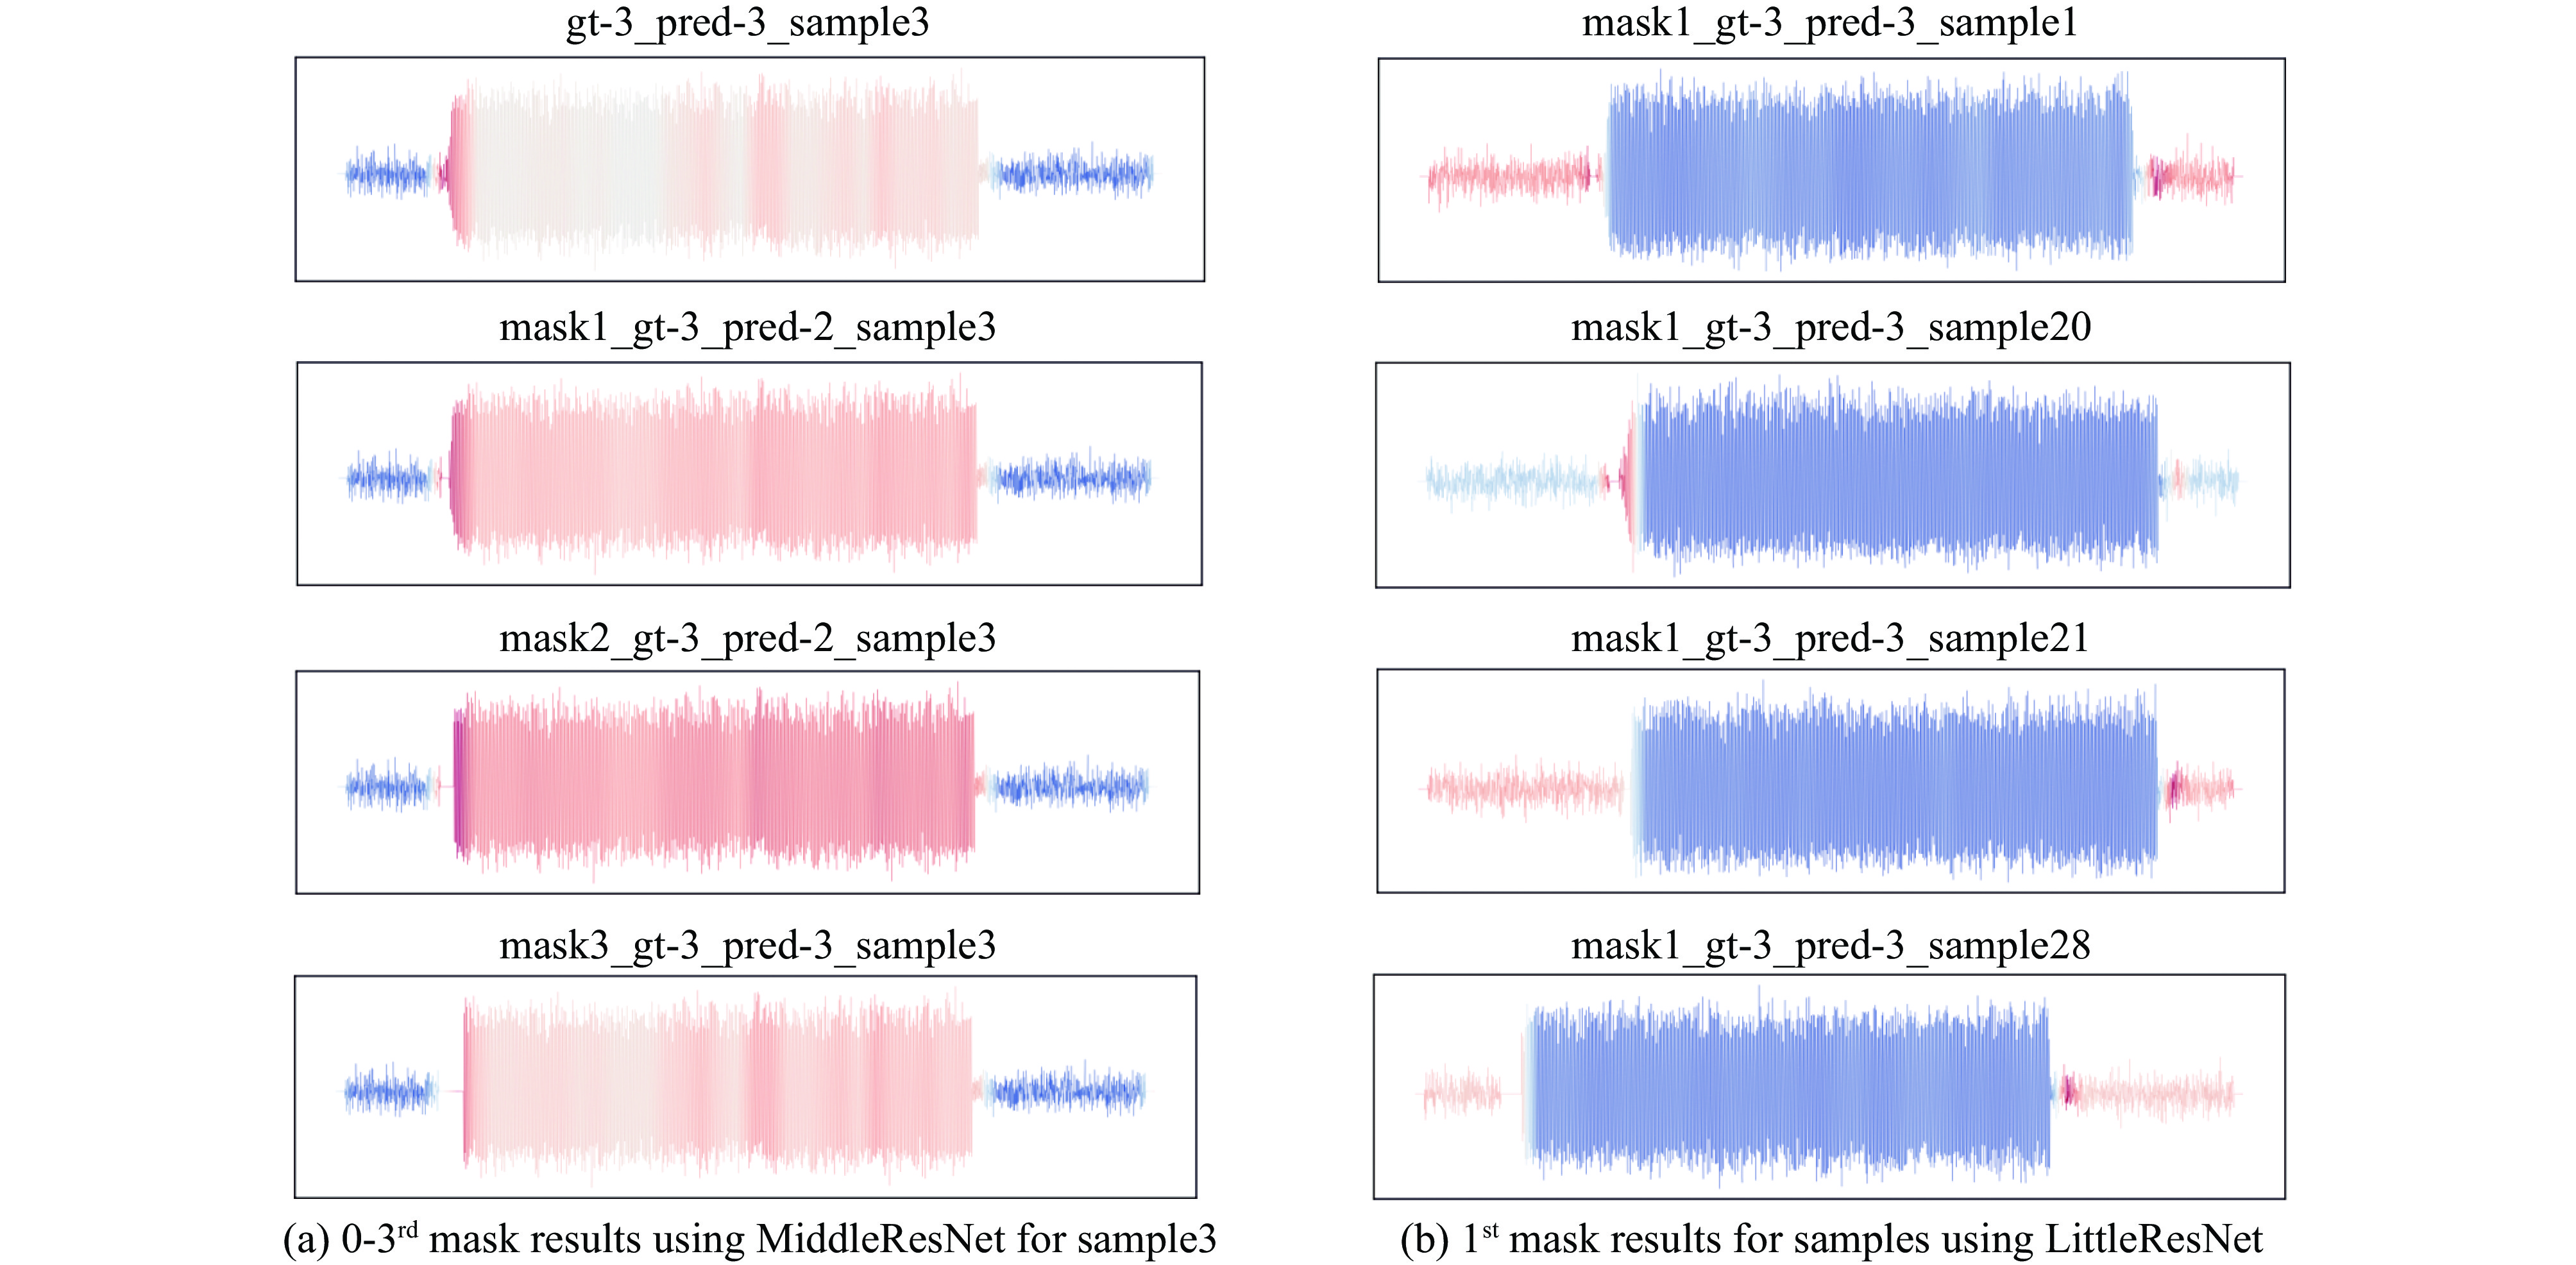
图 4 样本掩码测试对比
Figure 4. Test results by continuous mask and different samples comparison
表 1 三种模型的性能对比结果
Table 1. Performance comparison results of three models
model accuracy parameter number/106 5 dB 9 dB 14 dB all data LittleResNet 0.7605 0.8775 0.9605 0.8812 0.153 MiddleResNet 0.7665 0.8990 0.9685 0.8930 0.254 Transformer 0.8670 0.9493 0.995 0.9439 1.021  下载: 导出CSV
表 2 预测错误的样本数量及其序号
Table 2. Number and sequence of mispredicted samples
emitter Transformer MiddleResNet LittleResNet 1# 1
(sample23)4
(sample3,5,12,17)4
(sample5,10, 12, 23)2# 0 7
(sample3,5,7,14,19,22,28)6
(sample3,6,7,19,22,28)3# 0 0 0 4# 1
(sample19)2
(sample7,19)2
(sample7,19)5# 1
(sample9)1
(sample14)0 6# 0 0 0 7# 0 0 0 8# 0 0 0 9# 0 0 0 10# 0 0 0
下载: 导出CSV
表 3 MiddleResNet模型3#辐射源对象掩码预测结果
Table 3. Prediction results when masking 3# and using the MiddleResNet model
sample 1 2 3 4 5 6 7 8 9 10 11 12 13 14 15 16 17 18 19 20 21 22 23 24 25 26 27 28 29 30 no masking 3 3 3 3 3 3 3 3 3 3 3 3 3 3 3 3 3 3 3 3 3 3 3 3 3 3 3 3 3 3 1st masking 3 3 2 3 3 3 3 3 1 3 3 1 3 3 3 3 3 3 3 3 3 3 3 3 2 3 2 3 3 3 2nd masking 3 3 2 3 3 3 3 3 3 3 3 3 3 3 3 3 3 3 3 3 3 3 3 3 3 3 2 3 3 3 3rd masking 3 3 3 3 3 3 3 3 3 3 3 3 3 3 3 3 3 3 3 3 3 3 2 3 3 3 2 3 3 3
下载: 导出CSV
表 4 无掩码到3次掩码时误预测样本数量与误预测成的对象
Table 4. Number of mispredicted samples and emitter(s) mainly mispredicted to when masking different times
emitter MiddleResNet LittleResNet no
masking1st
masking2nd
masking3rd
maskingemitter(s) mainly
mispredicted tono
masking1st
masking2nd
masking3rd
maskingemitter(s) mainly
mispredicted to1# 4 27 29 29 2# 4 10 10 10 2# 2# 7 16 19 19 1#、3# 6 10 14 10 1#、3# 3# 0 5 2 2 2#、1# 0 0 0 0 —— 4# 2 13 27 29 3# 2 12 16 10 3#、2#、5#、1# 5# 1 20 29 29 3#、4# 0 5 14 17 3# 6# 0 13 28 30 7#、10# 0 15 23 25 7#、10# 7# 0 7 9 16 10#、3# 0 1 1 7 10#、3# 8# 0 9 20 28 10#、7#、9#、3# 0 7 13 16 10#、7#、6#、9# 9# 0 8 14 17 10#、7#、3# 0 6 13 16 10# 10# 0 2 11 15 7#、3# 0 2 3 4 7#
下载: 导出CSV
-
[1] Al-Shawabka A, Restuccia F, D’Oro S, et al. Exposing the fingerprint: dissecting the impact of the wireless channel on radio fingerprinting[C]//Proceedings of the IEEE INFOCOM 2020 - IEEE Conference on Computer Communications. 2020: 646-655. [2] Liu W B, Fan P Z, Wang M H, et al. Optical, acoustic and electromagnetic vulnerability detection for information security[J]. Journal of Physics:Conference Series, 2021, 1775: 012001. doi: 10.1088/1742-6596/1775/1/012001 [3] 刘文斌, 丁建锋, 寇云峰, 等. 物理隔离网络电磁漏洞研究[J]. 强激光与粒子束, 2019, 31:103215 doi: 10.11884/HPLPB201931.190132Liu Wenbin, Ding Jianfeng, Kou Yunfeng, et al. Research on electromagnetic vulnerability of air-gapped network[J]. High Power Laser and Particle Beams, 2019, 31: 103215 doi: 10.11884/HPLPB201931.190132 [4] José A. Gutiérrez del Arroyo Pérez. Learning robust radio frequency fingerprints using deep convolutional neural networks[D]. USA: Air Force Institute of Technology, 2022. [5] Yang Zhou, Liu Ninghao, Hu Xiaben, et al. Tutorial on deep learning interpretation: a data perspective[C]//Proceedings of the 31st ACM International Conference on Information & Knowledge Management. 2022: 5156-5159. [6] Srivastava G, Jhaveri R H, Bhattacharya S, et al. XAI for cybersecurity: state of the art, challenges, open issues and future directions[DB/OL]. arXiv preprint arXiv: 2206.03585, 2022. [7] 李辉. 基于类激活图的卷积神经网络可视化解释方法研究[D]. 长春: 吉林大学, 2023Li Hui. Research on visual interpretable method of convolutional neural networks based on class activation mapping[D]. Changchun: Jilin University, 2023 [8] Selvaraju R R, Cogswell M, Das A, et al. Grad-CAM: visual explanations from deep networks via gradient-based localization[C]//Proceedings of 2017 IEEE International Conference on Computer Vision. 2017: 618-626. [9] Kim J, Oh J, Heo T Y. Acoustic scene classification and visualization of beehive sounds using machine learning algorithms and grad-CAM[J]. Mathematical Problems in Engineering, 2021, 2021: 5594498. [10] 梁先明, 倪帆, 陈文洁, 等. 基于时频Grad-CAM的调制识别网络可解释研究[J/OL]. 西南交通大学学报, 2022. https://kns.cnki.net/kcms/detail/51.1277.u.20220608.1636.008.htmlLiang Xianming, Ni Fan, Chen Wenjie, et al. Interpretability of modulation recognition network based on time-frequency grad-CAM[J/OL]. Journal of Southwest Jiaotong University, 2022. https://kns.cnki.net/kcms/detail/51.1277.u.20220608.1636.008.html. [11] 倪帆. 基于可解释深度学习的通信信号调制识别算法研究[D]. 成都: 西南交通大学, 2022Ni Fan. Research on communication signal modulation recognition algorithm based on interpretable deep learning[D]. Chengdu: Southwest Jiaotong University, 2022 [12] 刘文斌, 范平志, 李雨锴, 等. 辐射源个体识别的一种可解释性测试架构[J]. 太赫兹科学与电子信息学报, 2023, 21(6): 734-744Liu Wenbin, Fan Pingzhi, Li Yukai, et al. An interpretable testing architecture for specific emitter identification[J]. Journal of Terahertz Science and Electronic Information Technology, 2023, 21(6): 734-744 [13] He Kaiming, Zhang Xiangyu, Ren Shaoqing, et al. Deep residual learning for image recognition[C]//Proceedings of 2016 IEEE Conference on Computer Vision and Pattern Recognition. 2016: 770-778. [14] Xiao Yao, Wei Xizhang. Specific emitter identification of radar based on one dimensional convolution neural network[J]. Journal of Physics:Conference Series, 2020, 1550: 032114. doi: 10.1088/1742-6596/1550/3/032114 [15] Wu Bin, Yuan Shibo, Li Peng, et al. Radar emitter signal recognition based on one-dimensional convolutional neural network with attention mechanism[J]. Sensors, 2020, 20: 6350. doi: 10.3390/s20216350 -

 点击查看大图
计量
- 文章访问数: 597
- HTML全文浏览量: 219
- PDF下载量: 67
- 被引次数: 0
