

Study on measurement and accuracy of tunnel network in booster of high energy photon source
-
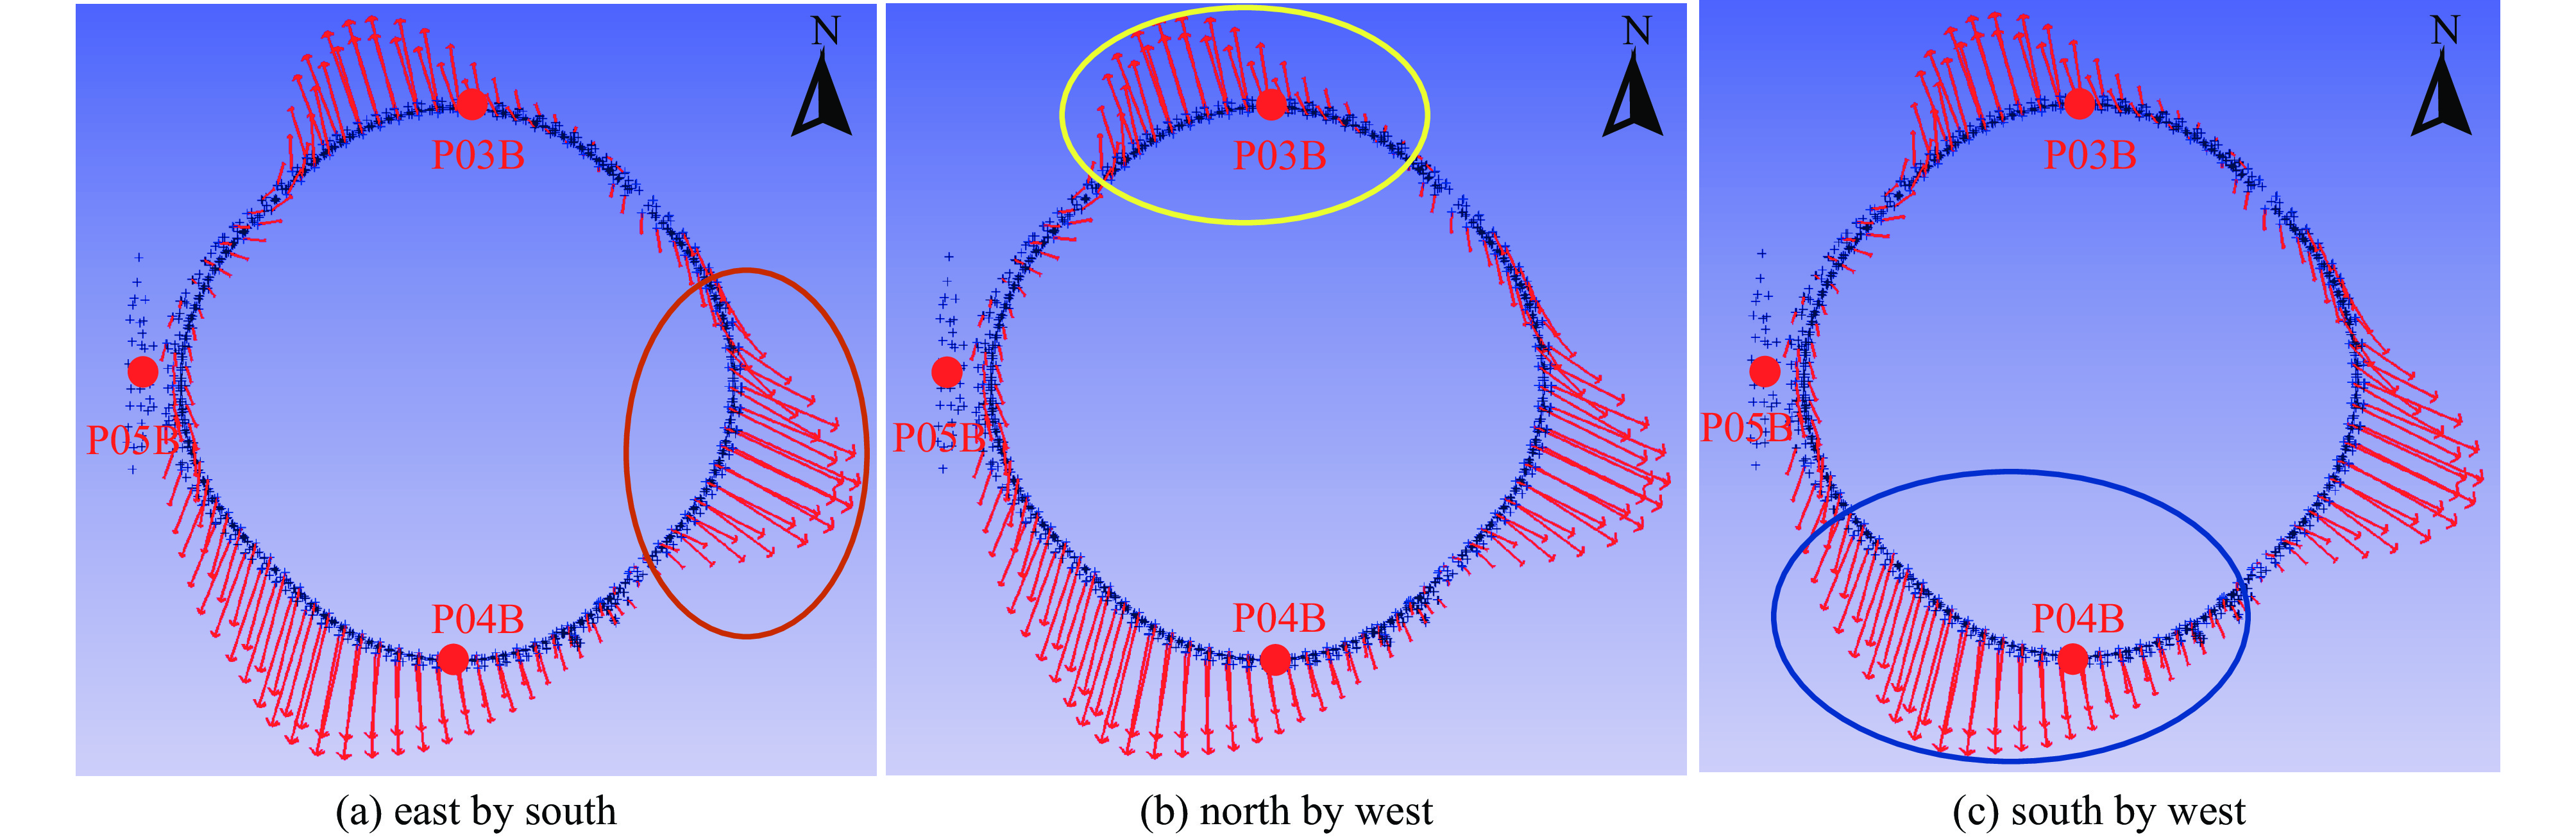
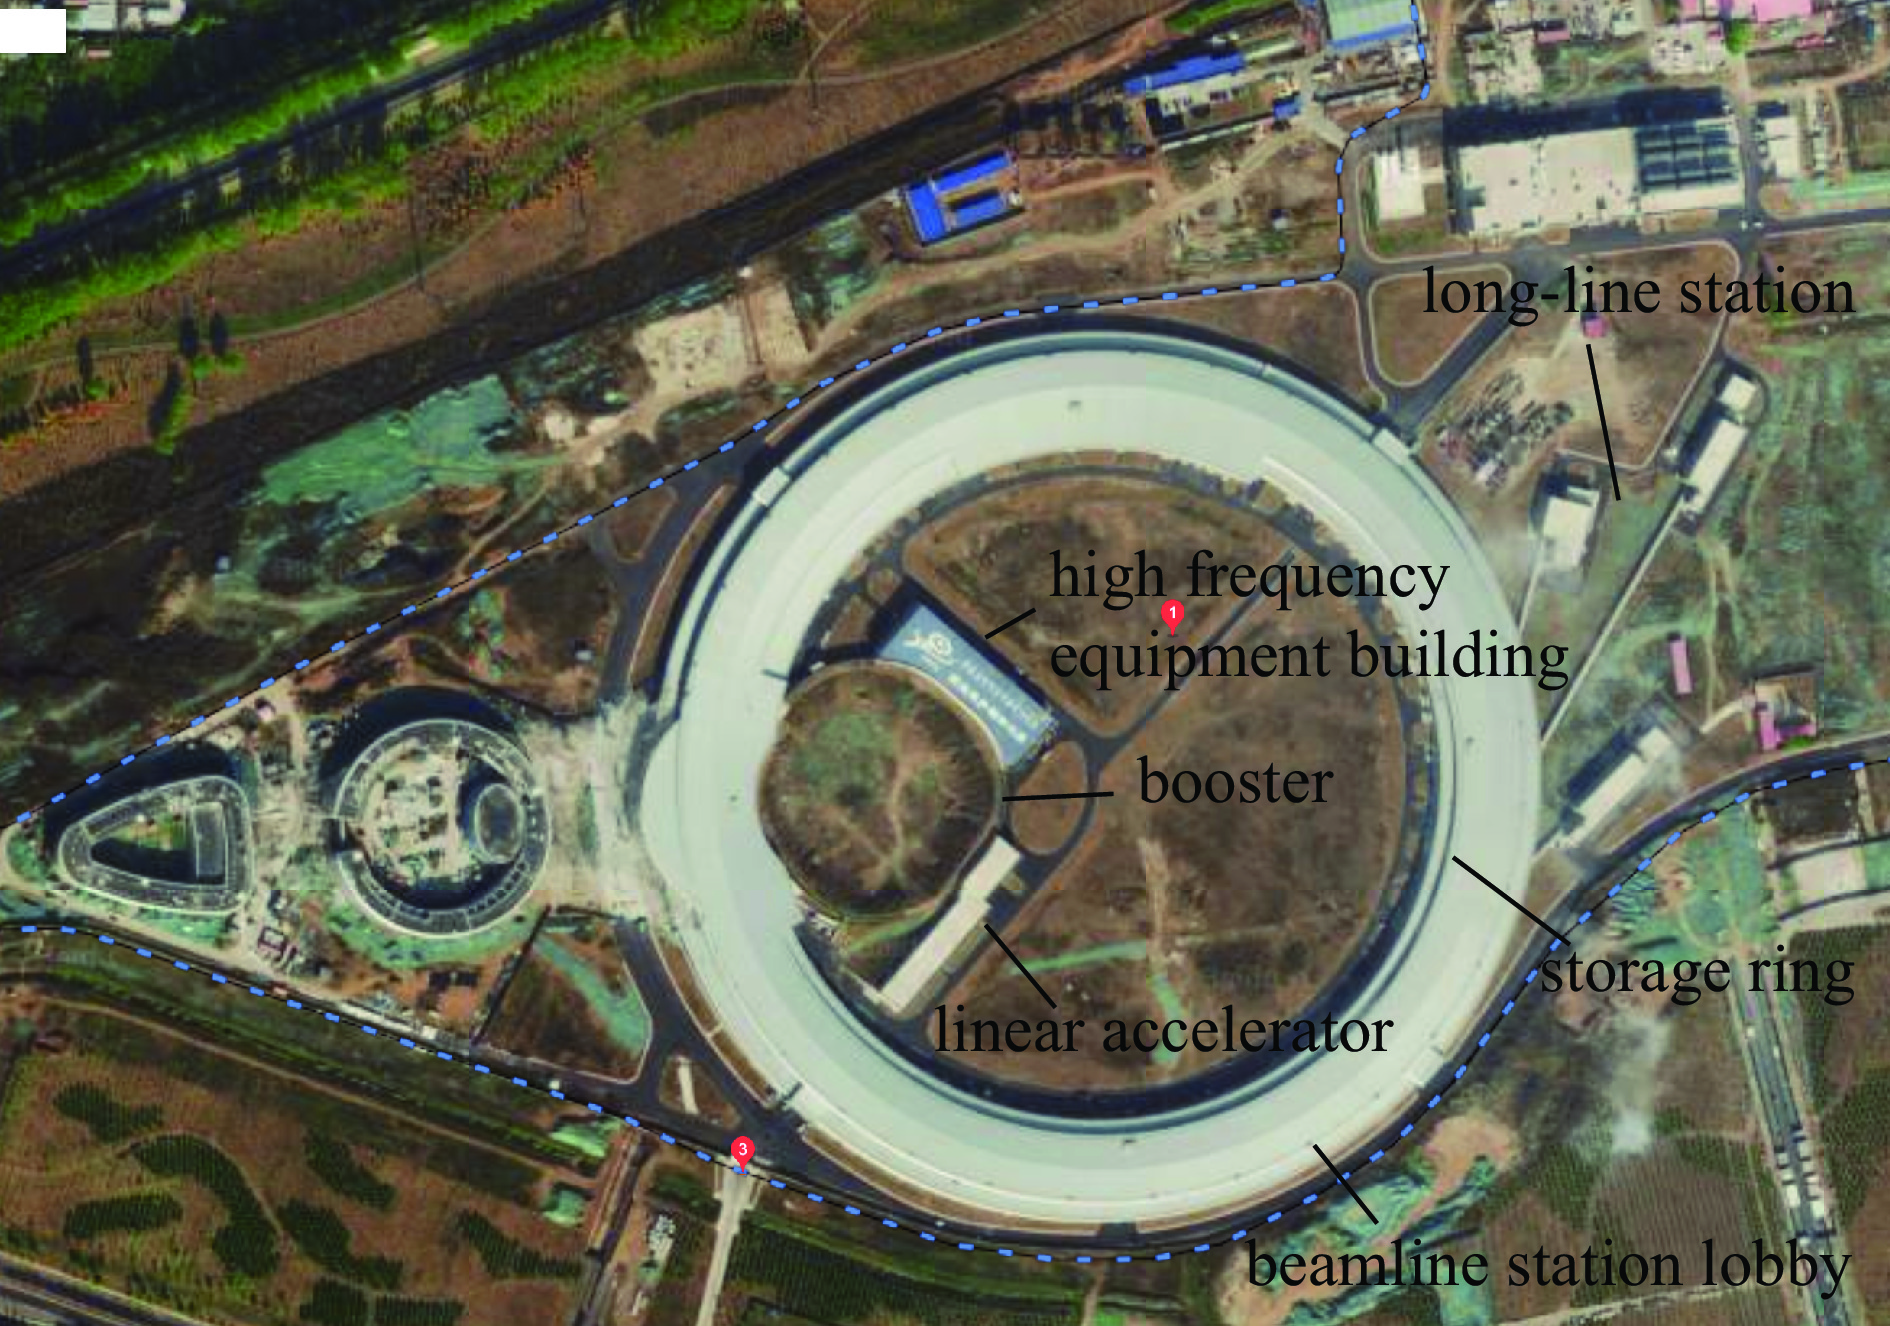
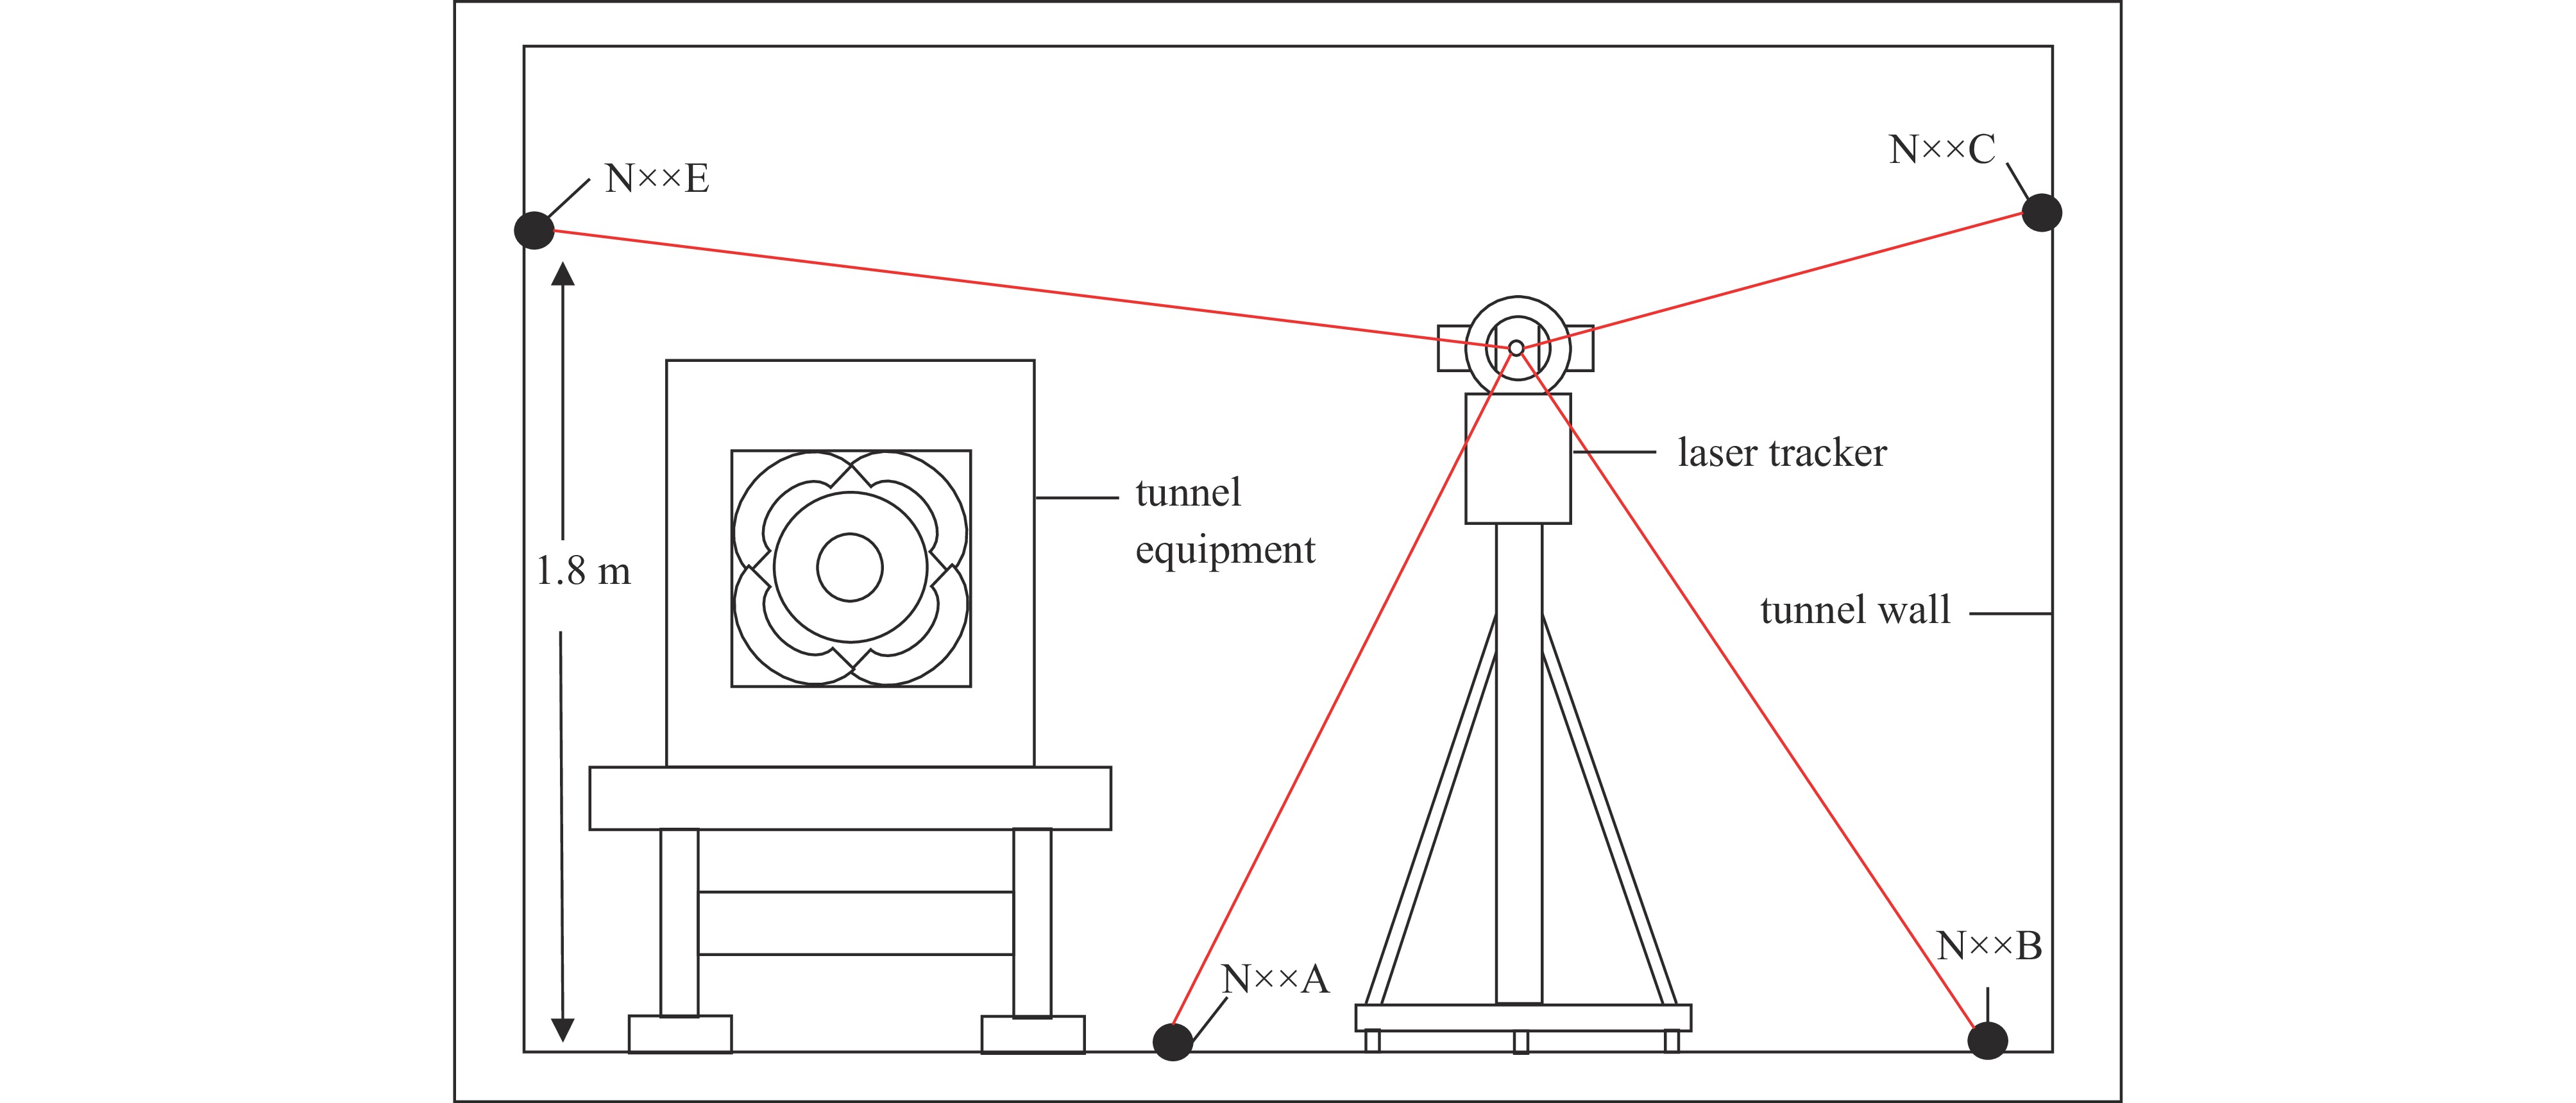
摘要: 随着粒子加速器对束流的稳定性要求越来越高,对工程控制网的精度提出了更高的要求,本文以高能同步辐射光源(HEPS)周长454 m的增强器为例,针对隧道内空间狭长、无法大范围通视的不利条件,提出了基于激光跟踪仪精密测量的控制网布设方案及测量方法;同时,面对测量环节中测站多和测点密的数据有效性检测难题,提出了相邻单站拟合及多站拟合的观测过程质量控制方法,点位拟合误差RMS优于0.1 mm;最终,控制网的径向、切向及高程方向各坐标分量的绝对点位误差RMS达到0.2 mm,满足设备安装精度要求。同时,为了监测增强器土建完毕初期的稳定性,对增强器控制网在一年内进行了两期观测,测量结果表明:增强器隧道在一年内产生了10 mm左右变形,具体表现为隧道地基在正东偏南、正北偏西、正南偏西三区域向外膨胀。Abstract:
Background With the increasing requirement of beam stability in particle accelerators, the accuracy of engineering control network is required to be higher.Purpose This study aims to elaborate the specific observation scheme for large-scale tunnel control network, and introduce the control network layout, measurement mode and data processing.Methods In this paper, taking the booster of High Energy Photon Source (HEPS) with the circumference of 454 m as an example, aiming at the disadvantages of narrow space in the tunnel, the control network layout scheme and measurement method based on laser tracker precision measurement are proposed. At the same time, in the face of the problem of data validity detection of multiple stations and close points in the measurement process, the quality control method of adjacent single station fitting and multi-station fitting is proposed, and the point fitting error RMS is better than 0.1 mm.Results Finally, the absolute point error RMS of radial, tangential and elevation coordinate components of the control network reaches 0.2 mm, which meets the installation accuracy requirements of the equipment. At the same time, in order to monitor the stability of the enhancer after the initial construction, two phases of the enhancer control network were observed in one year. The measurement results show that the deformation of the booster tunnel is about 10 mm in one year. The specific manifestation is that the tunnel foundation expands outward in the three areas of southeast, northwest and southwest.Conclusions Overall, the point accuracy of the three directions of the control network is different. The correctness and reliability of the results of the control network can be ensured through multiple control network measurements and data processing and analysis, which provides a reference for other synchrotron radiation light source.-
Key words:
- High Energy Photon Source /
- control network /
- laser tracker /
- adjustment treatment /
- precision analysis
-
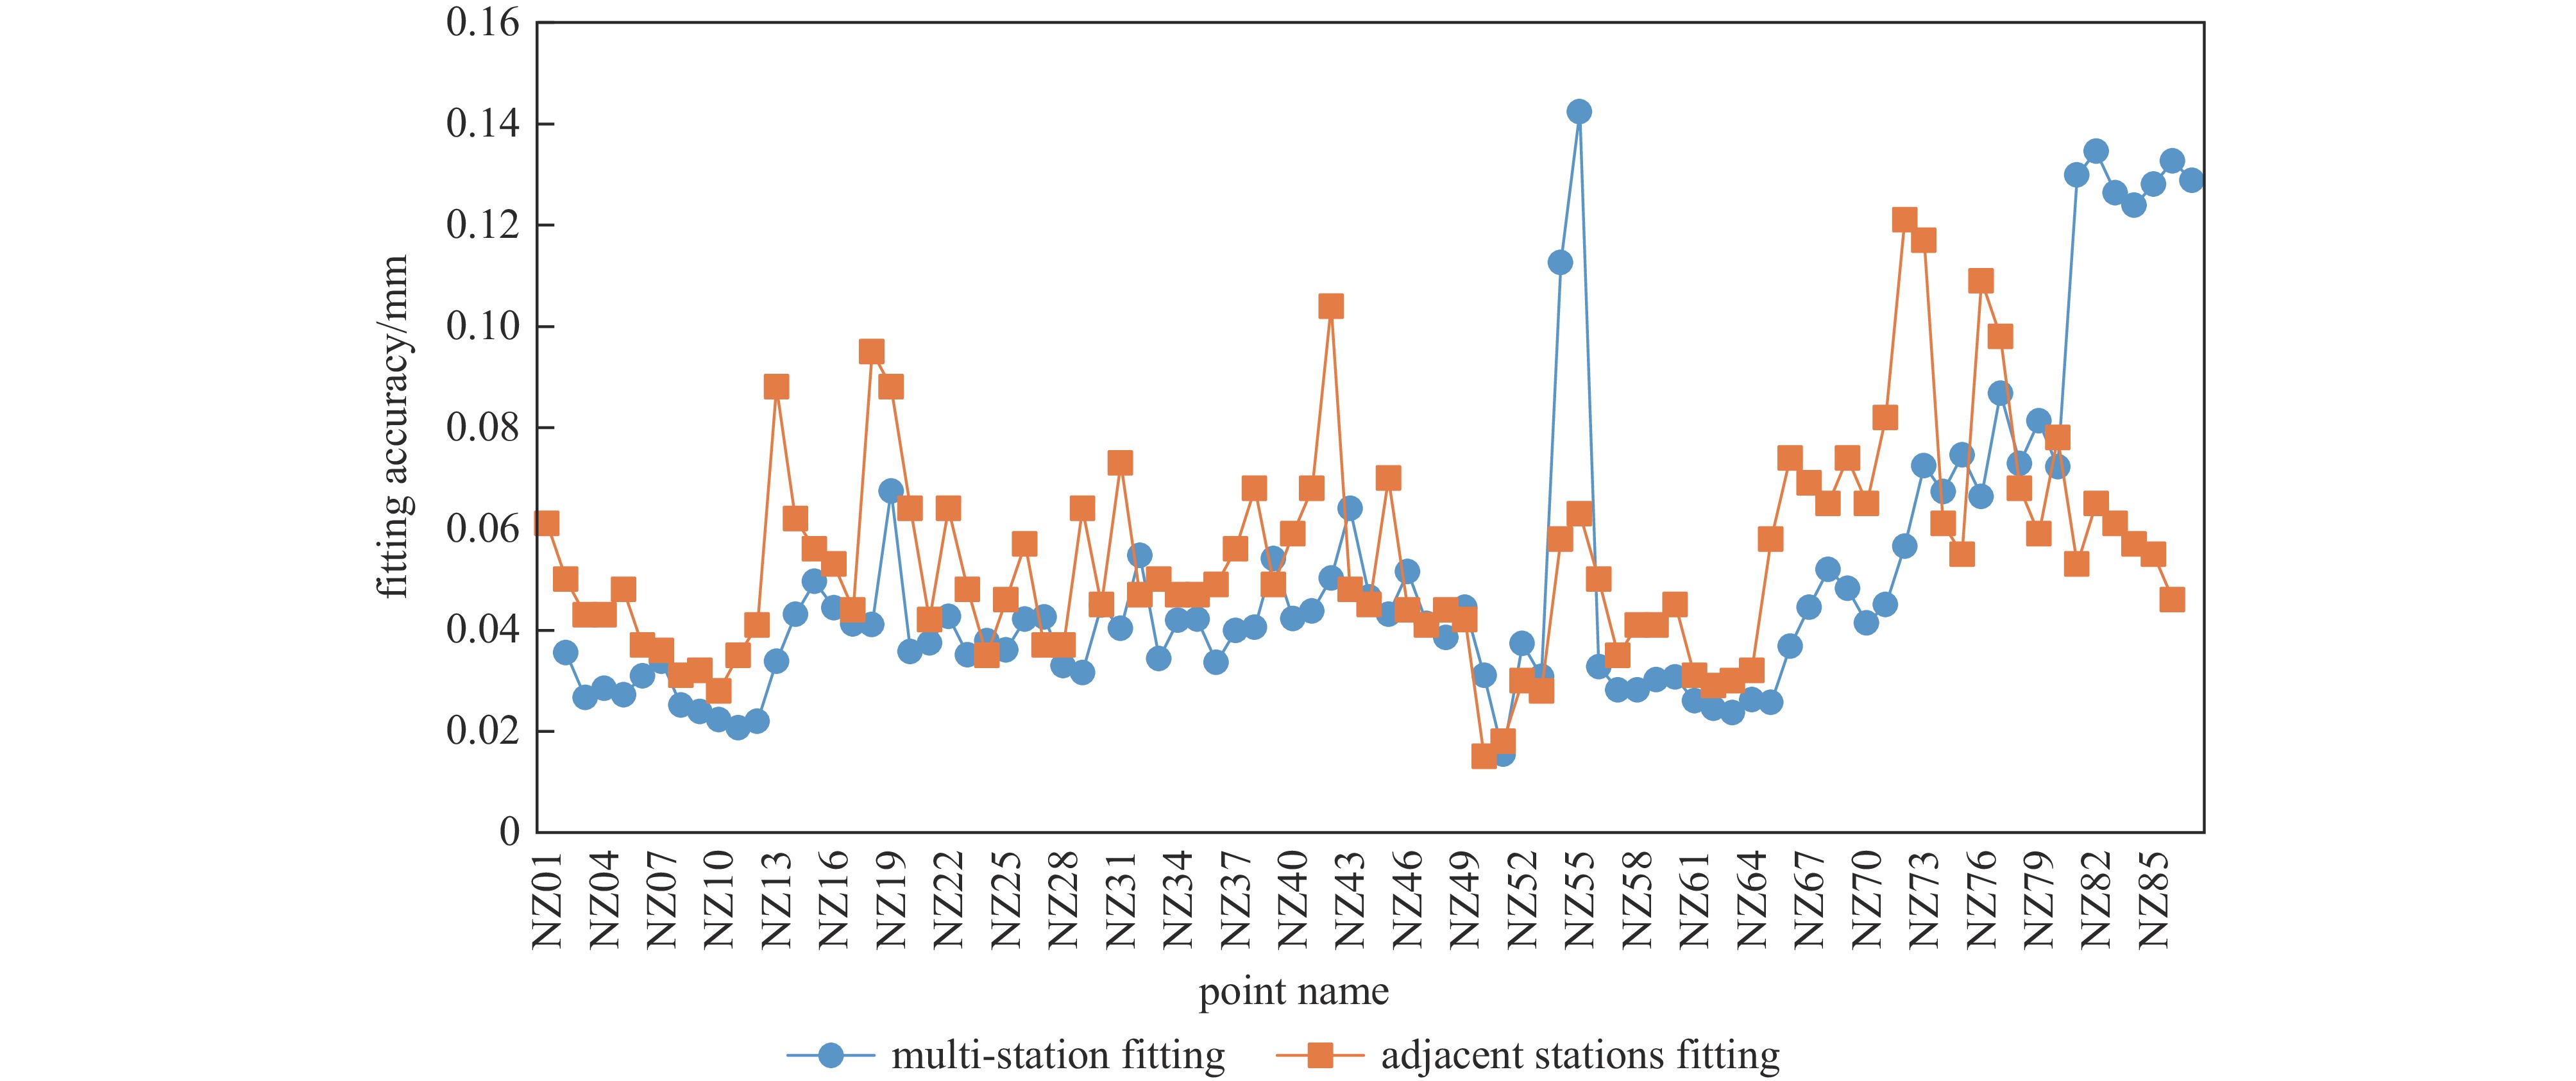
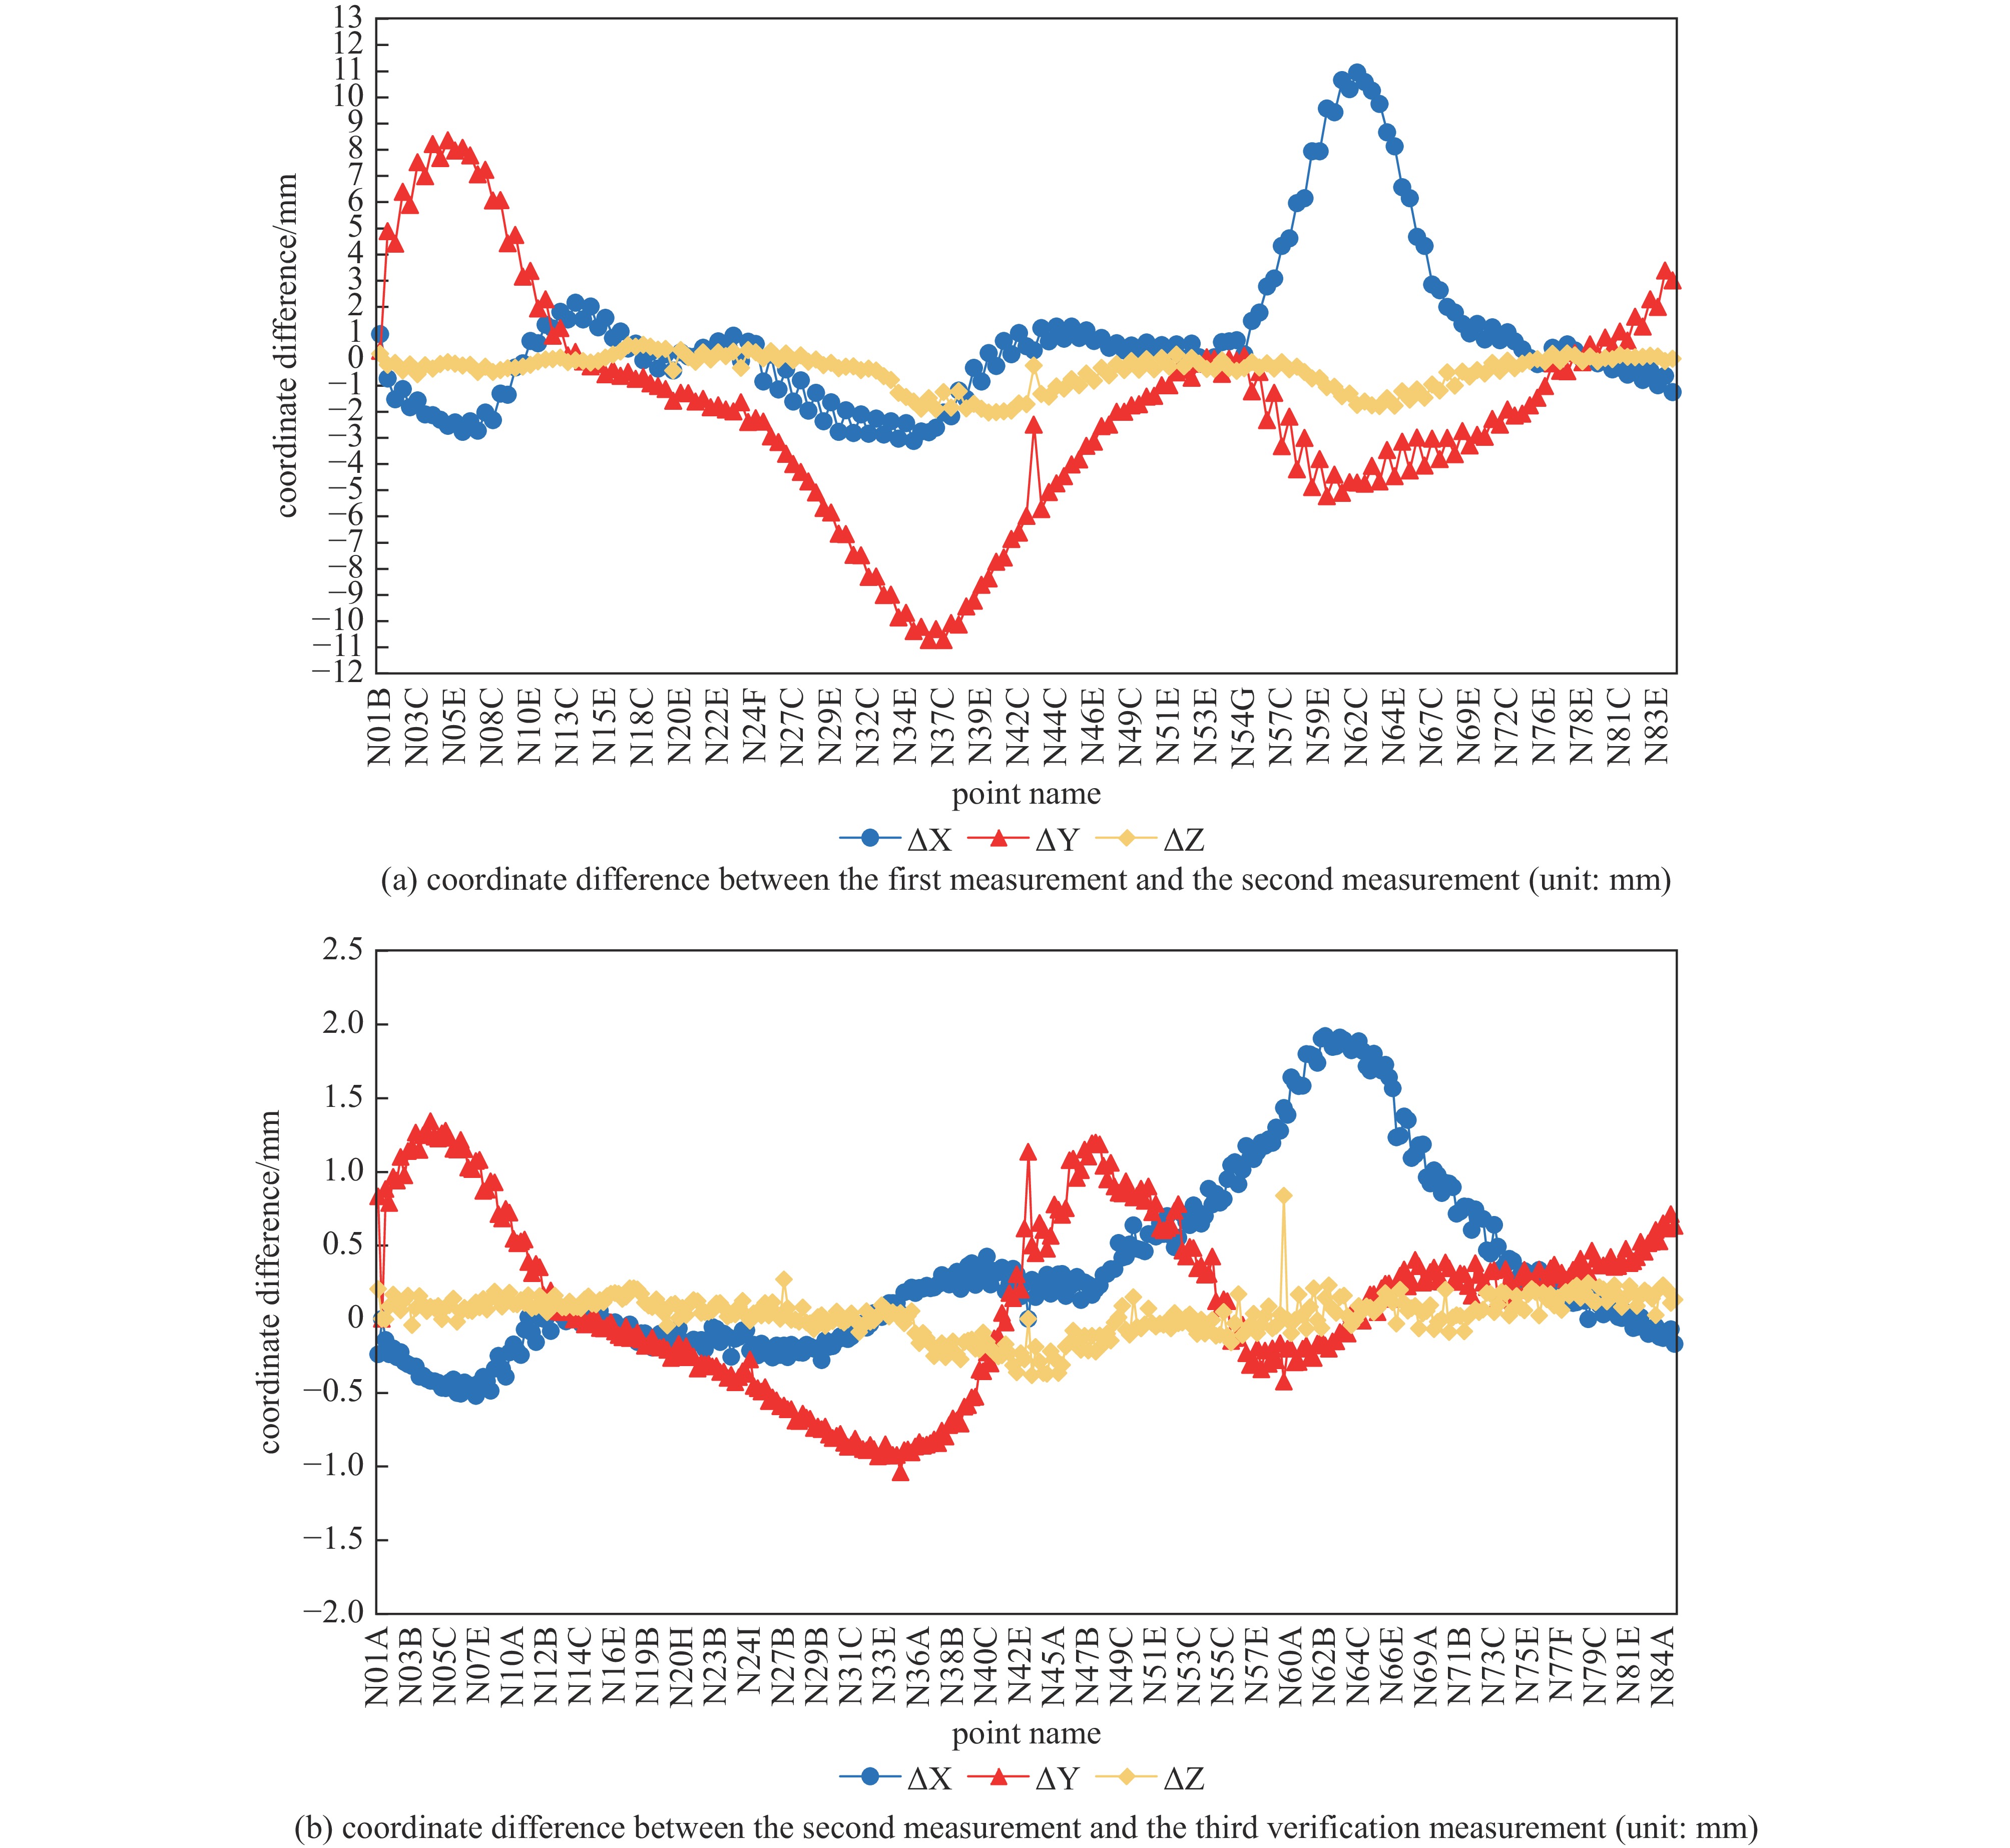
图 4 增强器首次测量拟合偏差统计
Figure 4. First measurement of the booster fitting deviation statistics
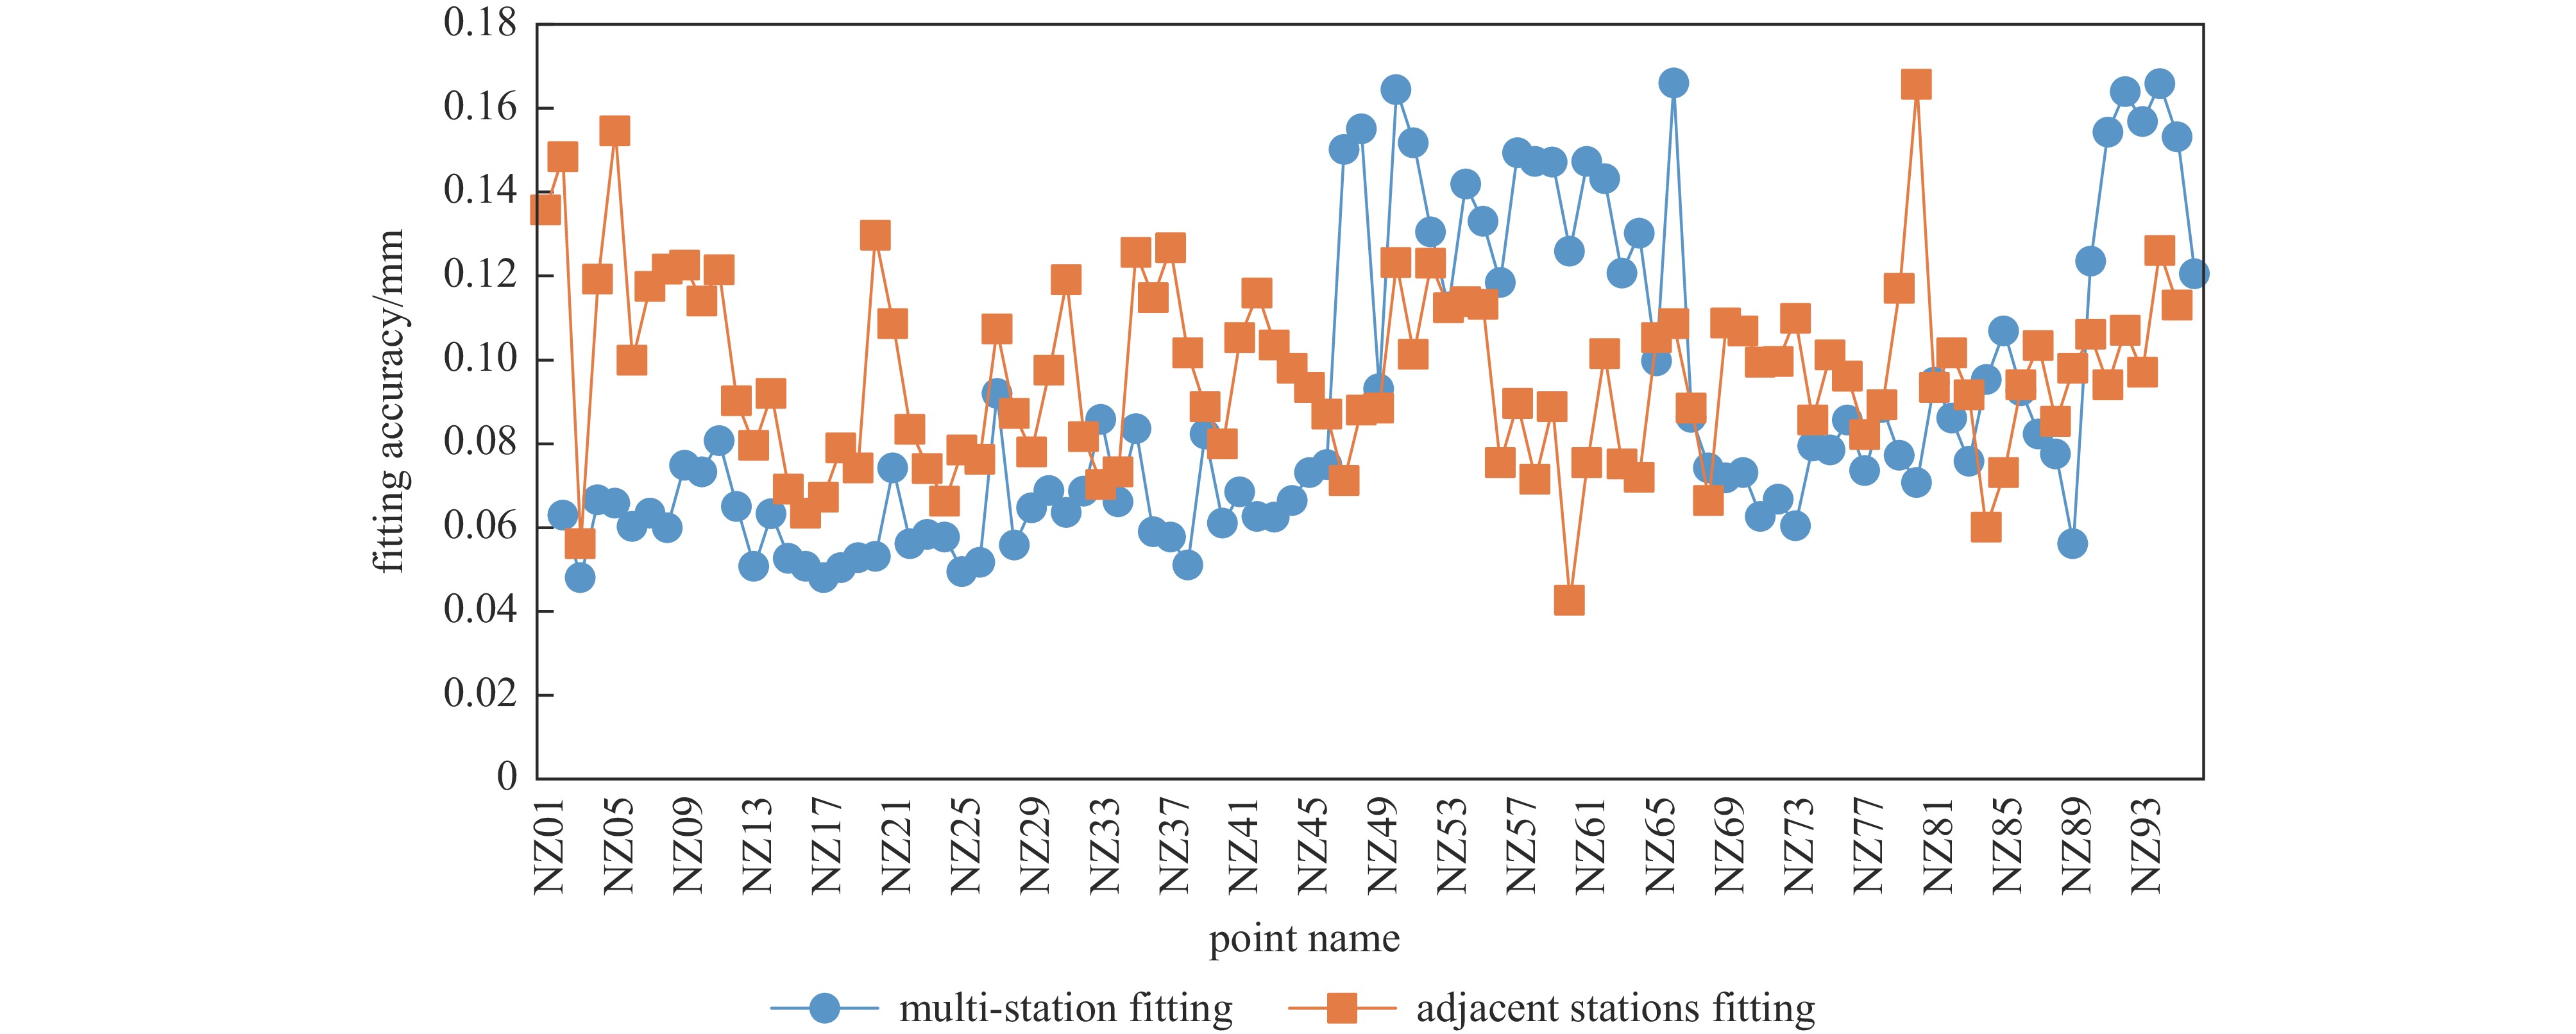
图 5 增强器第二次测量拟合偏差统
Figure 5. Statistics of fitting deviation of the second measurement of the booster
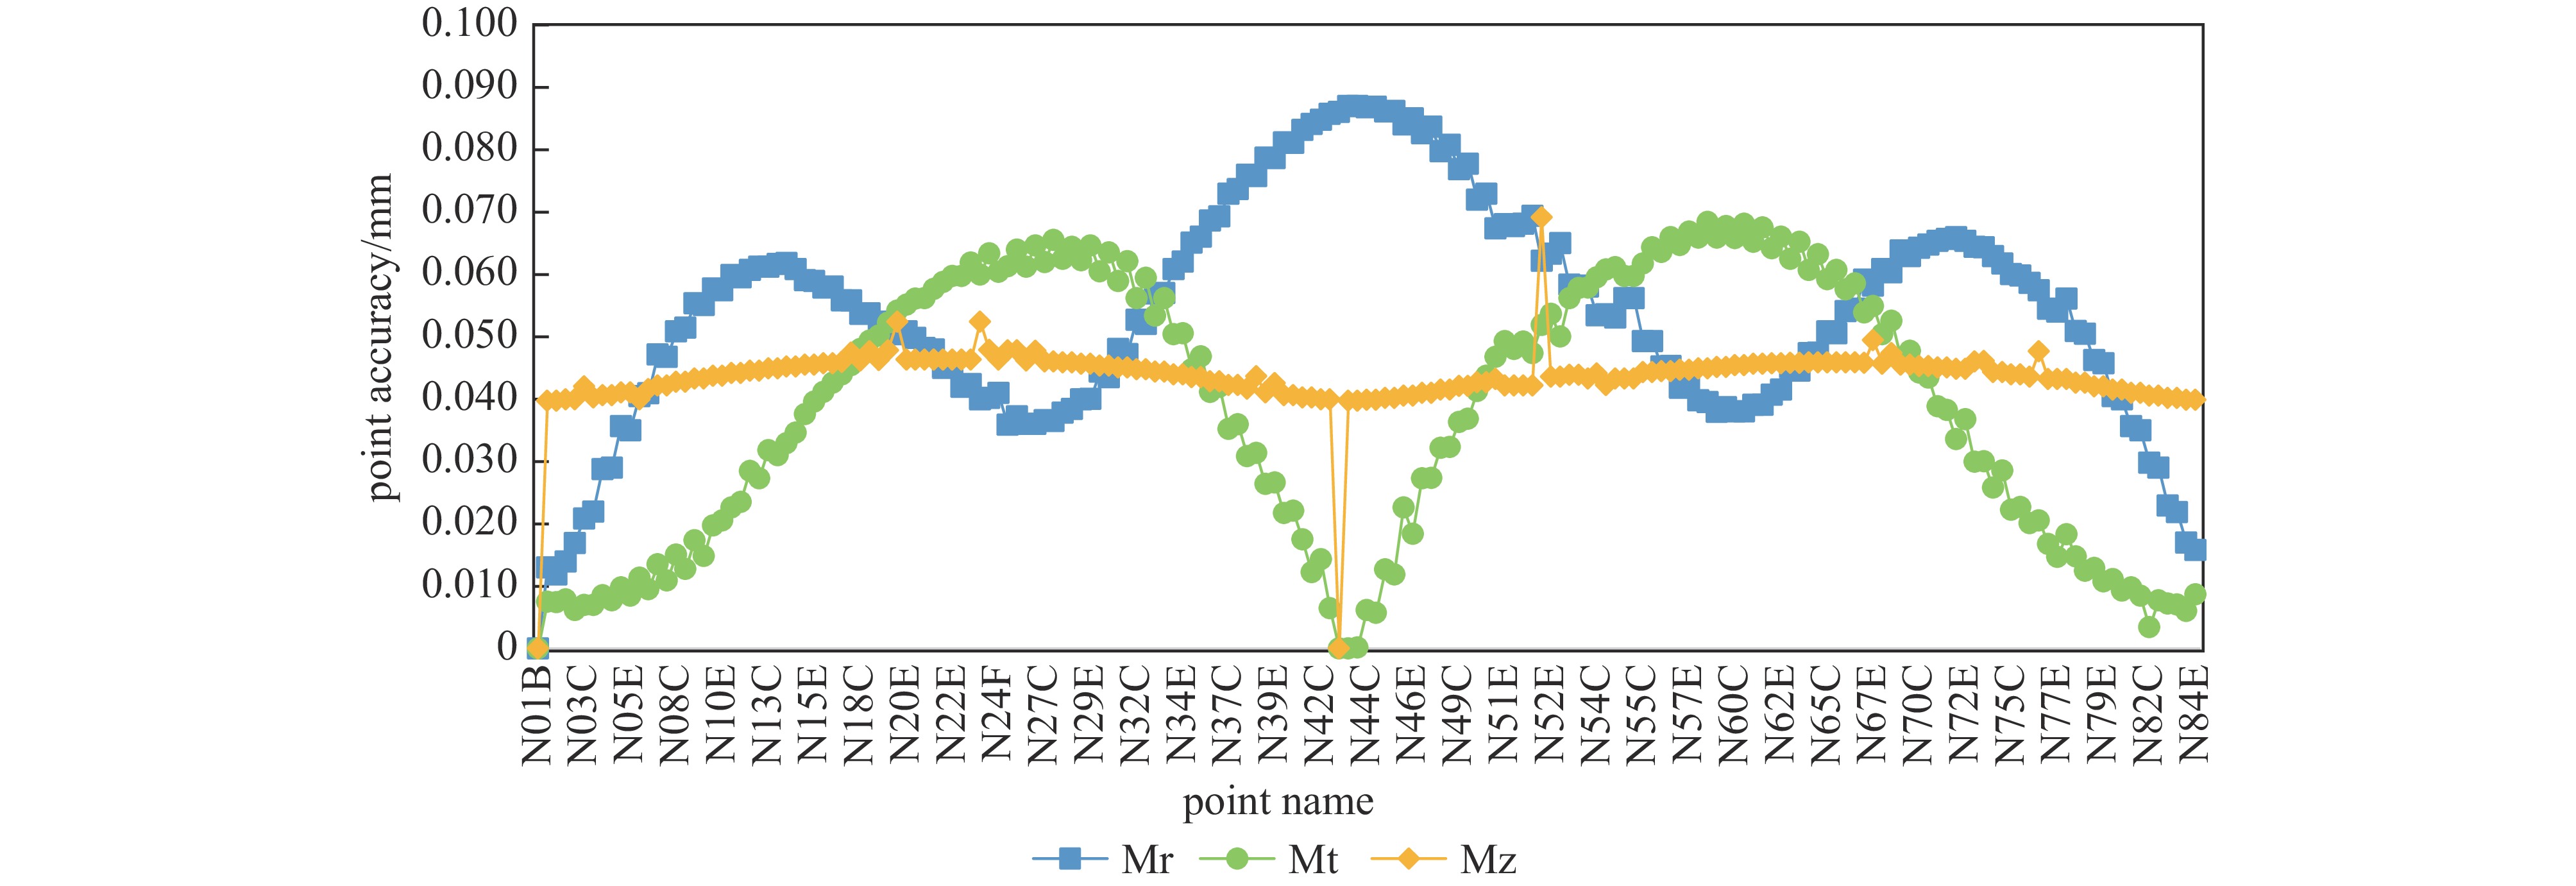
图 6 增强器首次测量绝对点位精度统计
Figure 6. Absolute point accuracy statistics for the first measurement of the booster
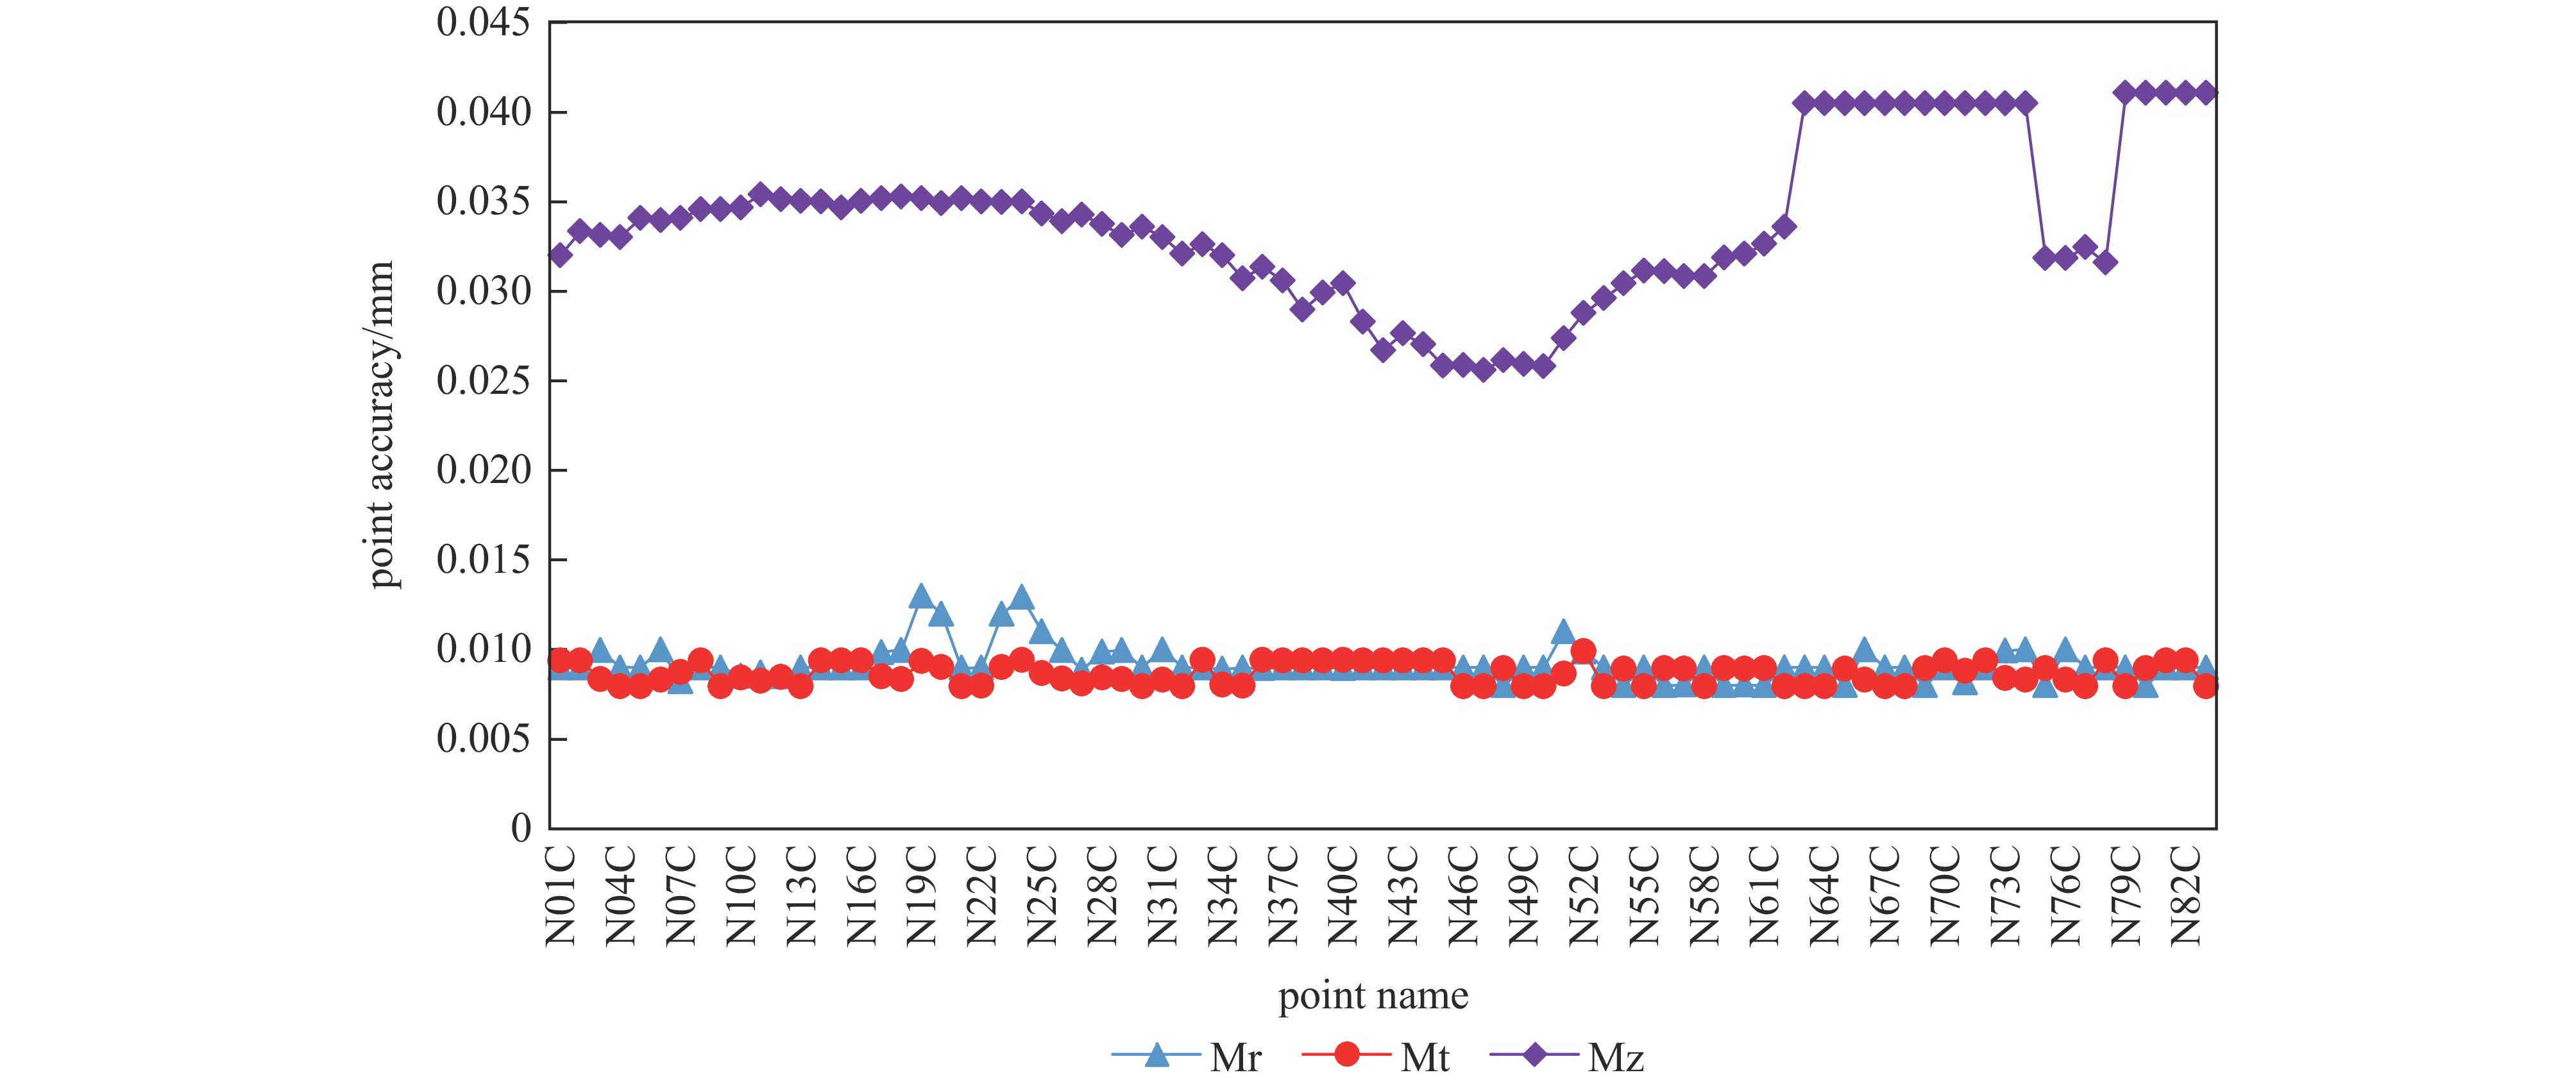
图 7 增强器首次测量相对点位精度统计
Figure 7. Relative point accuracy statistics of the first measurement of the booster
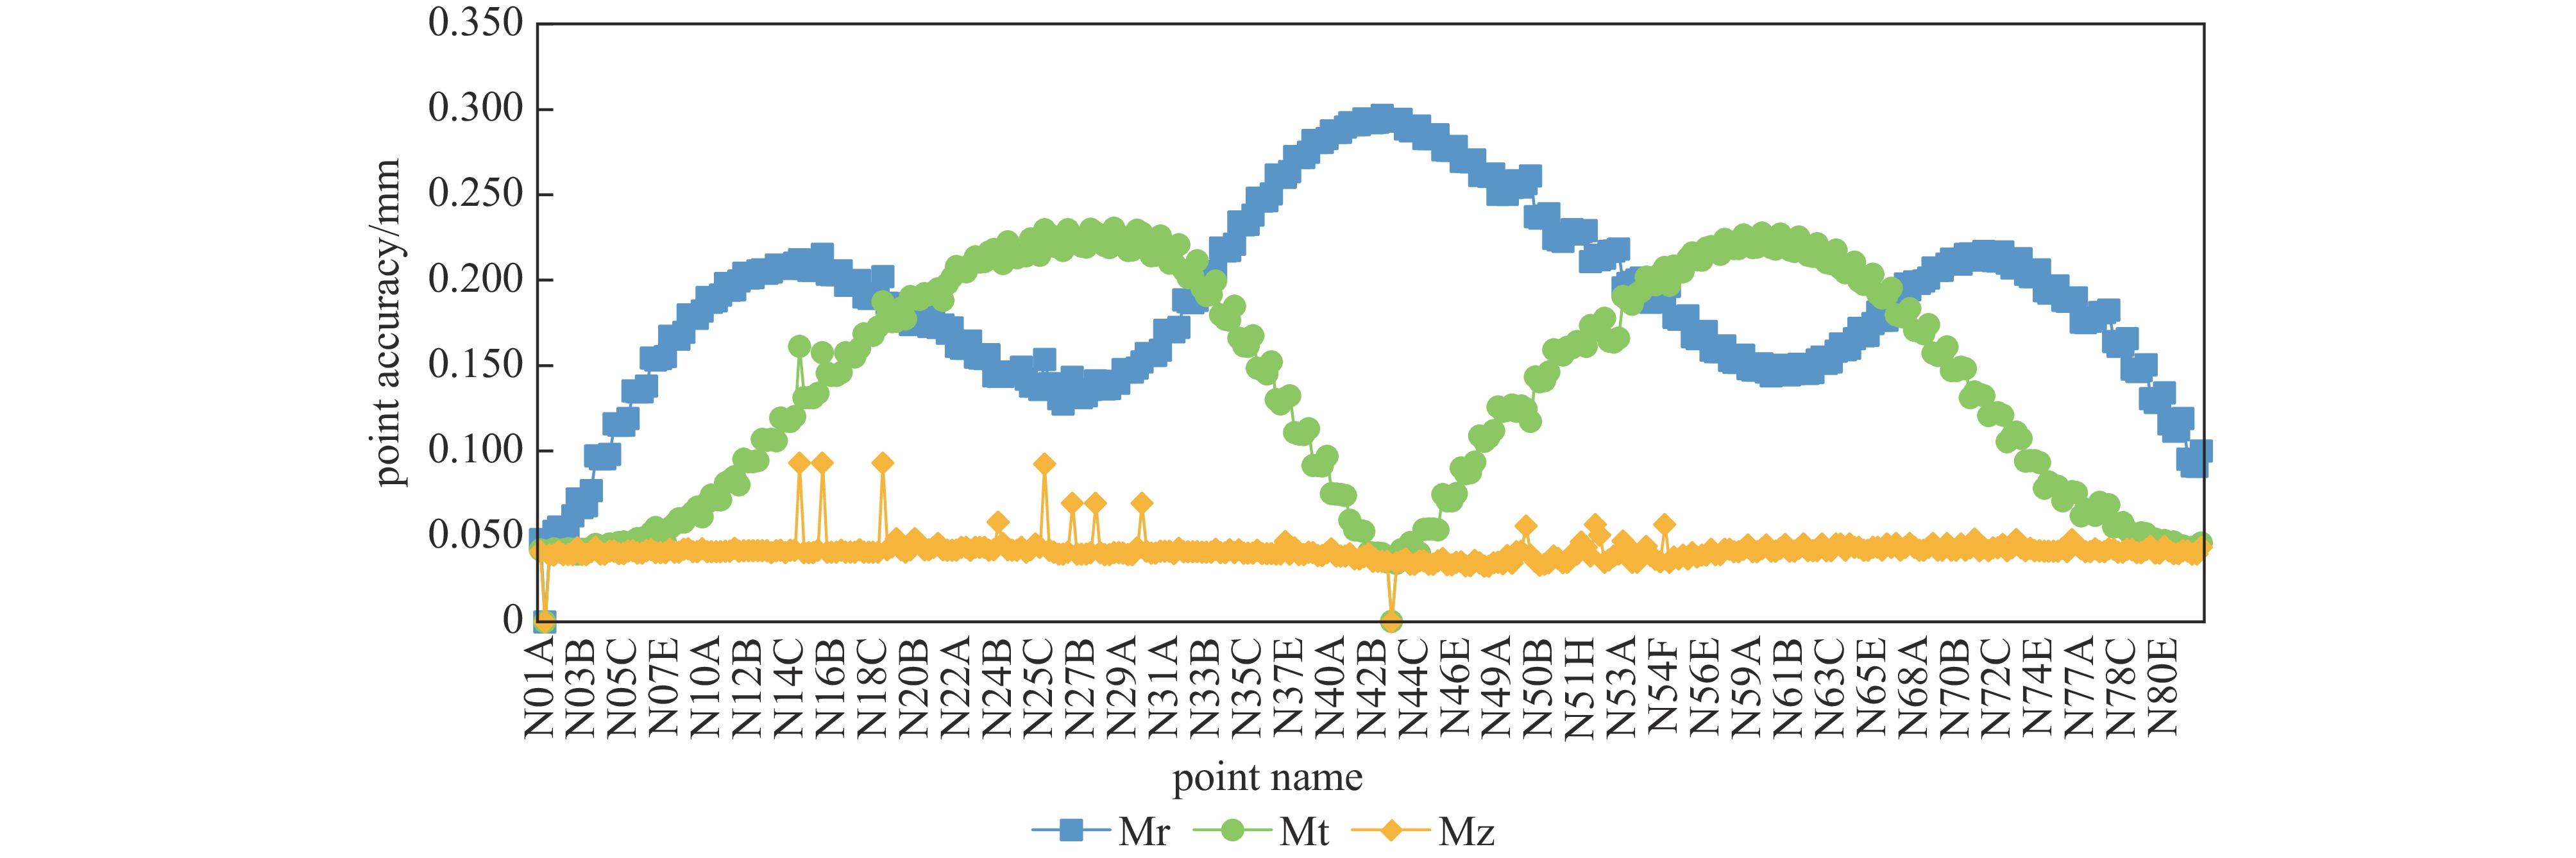
图 8 增强器第二次测量绝对点位精度统计
Figure 8. Absolute point accuracy statistics of the second measurement of the booster
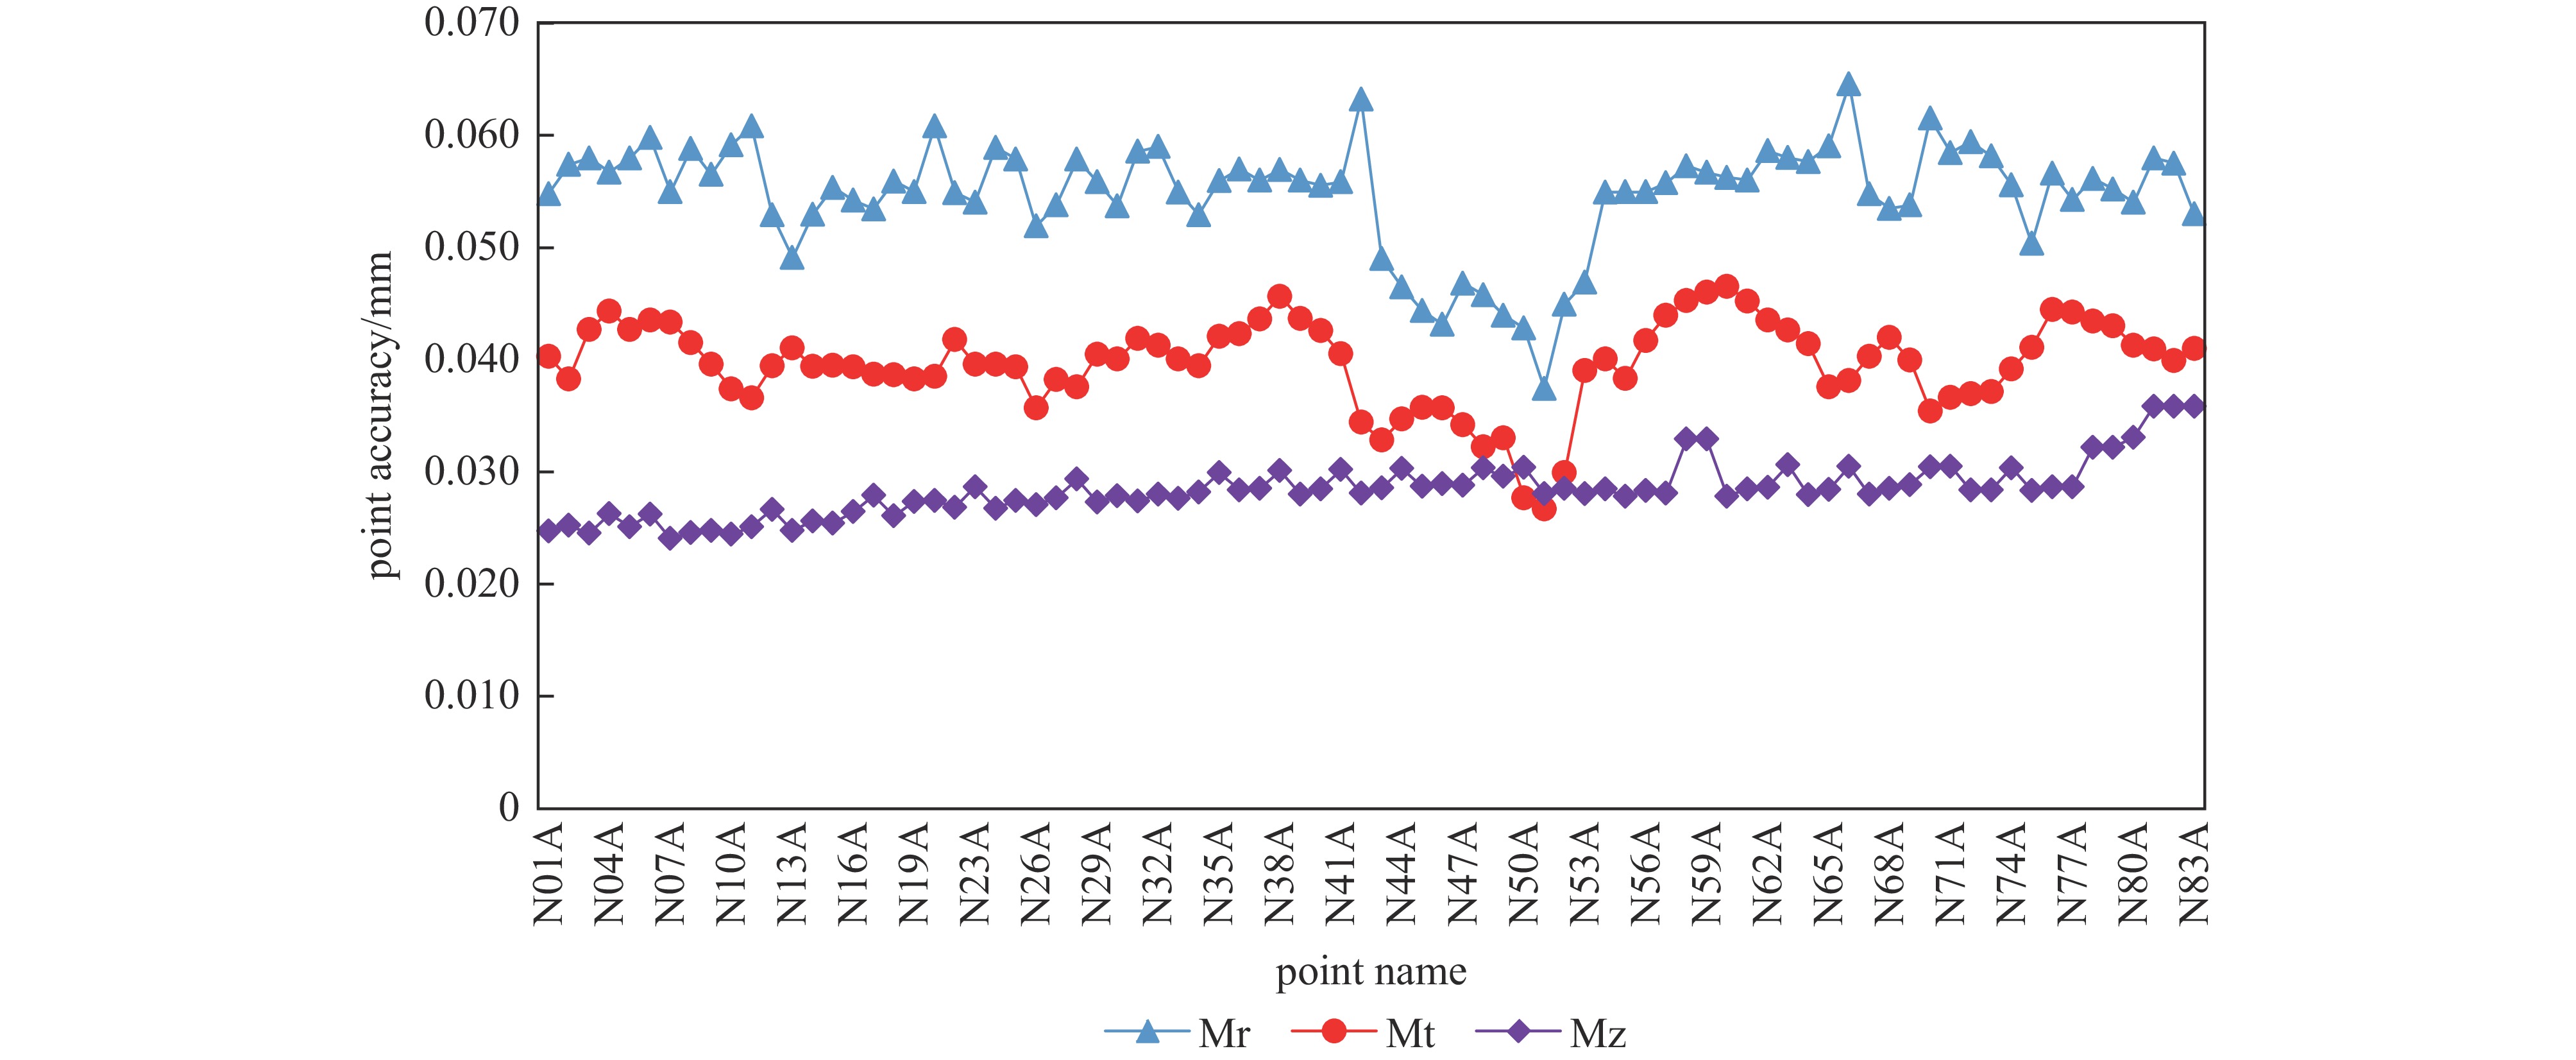
图 9 增强器第二次测量相对点位精度统计
Figure 9. Relative point accuracy statistics of the second measurement of the booster
表 1 测站间拟合精度统计表
Table 1. Statistical table of fitting accuracy between stations
maximum value/mm minimum value/mm mean value/mm RMS/mm first adjacent stations fitting 0.121 0.015 0.055 0.058 first multi-station fitting 0.142 0.016 0.051 0.059 second adjacent stations fitting 0.166 0.043 0.094 0.096 second multi-station fitting 0.166 0.048 0.089 0.096  下载: 导出CSV
表 2 两次地面网成果及坐标对比
Table 2. Two ground network results and coordinate comparison
point x/mm y/mm z/mm x/mm y/mm z/mm Δx/mm Δy/mm Δz/mm first surface network results second surface network results difference value P03B − 130232.554 75392.727 57803.56173 − 130231.6037 75393.04397 57803.7595 0.950 0.317 0.198 P04B − 130233.832 − 75376.151 57824.9754 − 130233.4951 − 75379.02807 57824.7247 0.337 −2.877 −0.251
下载: 导出CSV
表 3 增强器首次测量精度统计表
Table 3. First measurement accuracy statistics table of the booster
Mr/mm Mt/mm Mz/mm absolute point error maximum value 0.087 0.068 0.069 minimum value 0.000 0.000 0.000 RMS 0.057 0.044 0.044 mean value 0.054 0.038 0.044 relative point error maximum value 0.013 0.010 0.041 minimum value 0.008 0.008 0.026 RMS 0.009 0.009 0.034 mean value 0.009 0.009 0.034
下载: 导出CSV
表 4 增强器第二次测量精度统计表
Table 4. Statistical table of the second measurement accuracy of the booster
Mr/mm Mt/mm Mz/mm absolute point error maximum value 0.296 0.230 0.093 minimum value 0.000 0.000 0.000 RMS 0.193 0.152 0.042 mean value 0.185 0.137 0.041 relative point error maximum value 0.065 0.047 0.036 minimum value 0.037 0.027 0.024 RMS 0.055 0.040 0.029 mean value 0.055 0.040 0.028
下载: 导出CSV
表 5 两期数据永久点坐标差值
Table 5. The difference of permanent point coordinates between two periods of data
point Δx/mm Δy/mm Δz/mm P03B 0.950 0.317 0.198 P04B 0.337 −2.505 −0.250
下载: 导出CSV
表 6 第一次与第二次测量单站数据拟合结果
Table 6. The first and second measurements of the single station data fitting results
(mm) point x y z point x y z Δx Δy Δz deviation booster first measurement booster second measurement difference of fit N01E − 2154.015 − 3419.194 72.972 N01E − 2153.925 − 3419.103 72.947 0.090 0.091 −0.025 0.130 P03B 455.753 − 2936.756 − 1584.657 P03B 452.113 − 2939.324 − 1584.397 −3.640 −2.568 0.260 4.462 N84C 1998.115 − 8896.537 237.889 N84C 1998.504 − 8896.623 237.922 0.389 −0.086 0.033 0.399 N84E − 1405.302 − 9035.101 76.752 N84E − 1405.409 − 9035.364 76.836 −0.107 −0.263 0.084 0.296 N83C 2190.508 − 13907.794 −29.339 N83C 2190.790 − 13908.252 −29.005 0.282 −0.458 0.334 0.633 N02E − 3292.440 1579.134 86.768 N02E − 3292.027 1579.542 86.653 0.413 0.408 −0.115 0.592 N03E − 4966.306 6568.881 95.168 N03E − 4965.908 6569.416 95.031 0.398 0.535 −0.137 0.681 N04E − 7071.915 11371.418 67.343 N04E − 7071.855 11371.823 67.282 0.060 0.405 −0.061 0.414 N05E − 9635.486 16029.972 84.583 N05E − 9636.133 16029.987 84.687 −0.647 0.015 0.104 0.656 N01E − 2154.015 − 3419.194 72.972 N01E − 2153.925 − 3419.103 72.947 0.090 0.091 −0.025 0.130 N46E 13005.902 − 5004.357 99.298 N46E 13006.282 − 5004.653 99.668 0.380 −0.296 0.370 0.607 N45E 7991.025 − 2187.280 80.901 N45E 7991.297 − 2187.541 81.225 0.272 −0.261 0.324 0.497 N44E 3703.471 852.225 105.812 N44E 3703.690 852.140 106.074 0.219 −0.085 0.262 0.352 N44C 1681.837 − 1920.423 318.687 N44C 1681.675 − 1920.891 318.968 −0.162 −0.468 0.281 0.569 N43E −73.798 4043.163 86.369 N43E −73.634 4043.361 86.393 0.164 0.198 0.024 0.258 P04B − 2002.493 2183.522 − 1528.857 P04B − 2000.821 2186.391 − 1527.491 1.672 2.869 1.366 3.591 N43C − 2636.862 1709.145 357.933 N43C − 2637.133 1708.907 357.936 −0.271 −0.238 0.003 0.361 N42C − 6406.183 5574.865 319.908 N42C − 6406.619 5574.626 319.494 −0.436 −0.239 −0.414 0.647 N42E − 3857.964 7857.320 93.410 N42E − 3858.009 7857.533 93.070 −0.045 0.213 −0.340 0.404
下载: 导出CSV
表 7 第二次与第三次测量单站数据拟合结果
Table 7. The second and third measurements of the single station data fitting results
(mm) point x y z point x y z Δx Δy Δz deviation booster first measurement booster second measurement difference of fit N02E − 2430.261 2204.415 288.202 N02E − 2430.206 2204.456 288.287 0.055 0.041 0.085 0.109 N03A 627.550 6670.640 − 1383.339 N03A 627.624 6670.683 − 1383.229 0.074 0.043 0.111 0.140 N04A 1734.094 12537.945 − 1382.390 N04A 1734.067 12538.040 − 1382.346 −0.027 0.095 0.045 0.108 N83B − 6895.974 − 13549.849 − 1384.002 N83B − 6896.052 − 13549.960 − 1384.001 −0.078 −0.111 0.002 0.136 N84B − 4236.805 − 9399.401 − 1383.172 N84B − 4236.856 − 9399.482 − 1383.166 −0.051 −0.081 0.007 0.096 N84A − 5501.753 − 8583.214 − 1383.938 N84A − 5501.905 − 8583.237 − 1383.924 −0.152 −0.023 0.015 0.154 N01C − 1328.642 − 4234.699 420.347 N01C − 1328.592 − 4234.776 420.312 0.050 −0.077 −0.036 0.099 P03B − 1909.093 − 3640.849 − 1382.848 P03B − 1909.863 − 3640.697 − 1382.845 −0.770 0.152 0.004 0.784 N01A − 2051.384 − 1546.725 − 1382.119 N01A − 2051.394 − 1546.708 − 1382.021 −0.010 0.017 0.099 0.101 N44B 1277.827 2778.162 − 1551.890 N44B 1277.852 2778.136 − 1551.930 0.025 −0.026 −0.040 0.053 N44A −120.801 3287.963 − 1552.411 N44A −120.736 3287.952 − 1552.451 0.065 −0.011 −0.040 0.077 N43A − 1371.188 171.988 − 1549.324 N43A − 1371.181 172.072 − 1549.412 0.007 0.084 −0.088 0.121 P04B − 1367.688 − 2001.620 − 1530.638 P04B − 1368.130 − 2001.602 − 1530.622 −0.442 0.018 0.016 0.442 N43C −724.774 − 2470.177 354.789 N43C −724.857 − 2470.072 354.698 −0.083 0.105 −0.091 0.161 N42C − 3316.924 − 7206.586 316.347 N42C − 3316.953 − 7206.461 316.248 −0.029 0.125 −0.099 0.162 N42B − 3519.240 − 7122.133 − 1555.201 N42B − 3519.246 − 7122.024 − 1555.186 −0.006 0.109 0.015 0.110 N42A − 4759.557 − 6322.921 − 1556.183 N42A − 4759.506 − 6322.845 − 1556.206 0.051 0.076 −0.023 0.095 N41C − 6361.835 − 11810.764 326.681 N41C − 6361.734 − 11810.635 326.654 0.101 0.129 −0.027 0.166 N44B 1277.827 2778.162 − 1551.890 N44B 1277.852 2778.136 − 1551.930 0.025 −0.026 −0.040 0.053
下载: 导出CSV
-
[1] 焦毅, 潘卫民. 高能同步辐射光源[J]. 强激光与粒子束, 2022, 34:104002Jiao Yi, Pan Weimin. High energy photon source[J]. High Power Laser and Particle Beams, 2022, 34: 104002 [2] 蔡国柱, 王少明, 满开第, 等. CSR工程3维测量控制网[J]. 强激光与粒子束, 2005, 17(10):1590-1594Cai Guozhu, Wang Shaoming, Man Kaidi, et al. Survey control network of HIRFL-CSR[J]. High Power Laser and Particle Beams, 2005, 17(10): 1590-1594 [3] 于成浩, 董岚, 柯明, 等. 大尺寸激光跟踪仪三维控制网平面精度研究[J]. 测绘科学, 2008, 33(2):42-44Yu Chenghao, Dong Lan, Ke Ming, et al. The plane accuracy research of 3D control network based on laser tracker in large-scale space[J]. Science of Surveying and Mapping, 2008, 33(2): 42-44 [4] 王铜, 董岚, 梁静, 等. 中国散裂中子源准直控制网数据处理方法[J]. 强激光与粒子束, 2021, 33:104002Wang Tong, Dong Lan, Liang Jing, et al. Adjustment method of control network for alignment in CSNS[J]. High Power Laser and Particle Beams, 2021, 33: 104002 [5] 马娜, 董岚, 梁静, 等. 中国散裂中子源隧道控制网测量方法及精度探讨[J]. 核科学与工程, 2018, 38(3):411-416Ma Na, Dong Lan, Liang Jing, et al. Measurement of the tunnel control network of CSNS and accuracy research[J]. Nuclear Science and Engineering, 2018, 38(3): 411-416 [6] 郭迎钢, 李宗春, 李广云, 等. 粒子加速器工程控制网研究进展与展望[J]. 测绘通报, 2020(1):136-141Guo Yinggang, Li Zongchun, Li Guangyun, et al. Progress and prospect of engineering control network for particle accelerator[J]. Bulletin of Surveying and Mapping, 2020(1): 136-141 [7] 于成浩, 柯明. 基于激光跟踪仪的三维控制网测量精度分析[J]. 测绘科学, 2006, 31(3):25-27,3Yu Chenghao, Ke Ming. The measurement accuracy analysis of three dimensional control network based on laser tracker[J]. Science of Surveying and Mapping, 2006, 31(3): 25-27,3 [8] 王巍. 合肥光源升级改造测量准直及测量精度的研究[D]. 合肥: 中国科学技术大学, 2016Wang Wei. Survey and alignment of the HLS II upgrade project and study of the measurement precision[D]. Hefei: University of Science and Technology of China, 2016 [9] Wu Enchen, Wang Wei, Li Xiao, et al. Research on fusion and deformation analysis of decade’ HLS-II control network surveying data[J]. Journal of Instrumentation, 2024, 19: P05043. doi: 10.1088/1748-0221/19/05/P05043 [10] 闫皓月, 董岚, 王铜, 等. 高能同步辐射光源地面网测量方案及数据处理[J]. 强激光与粒子束, 2023, 35:114003 doi: 10.11884/HPLPB202335.230117Yan Haoyue, Dong Lan, Wang Tong, et al. Surface network survey scheme and data processing at high energy photon source[J]. High Power Laser and Particle Beams, 2023, 35: 114003 doi: 10.11884/HPLPB202335.230117 [11] Dong Lan. The alignment of BEPCII LINAC[C]//8th International Workshop on Accelerator Alignment. 2004. [12] Spatial Metri X Corporation. SMX tracker 4000, 4500 operator’s guide[R]. Lake Mary: FARO Technologies, Inc. , 2002. [13] 东莞中子科学中心. 激光跟踪仪测量数据处理系统V1.0: 2017SR681327[P]. 2017-04-03Dongguan Neutron Science Center. Laser tracker data processing system V1.0: 2017SR681327[P]. 2017-04-03 [14] 马娜, 董岚, 梁静, 等. 中国散裂中子源直线加速器控制网测量及精度研究[J]. 测绘通报, 2016(1):104-107Ma Na, Dong Lan, Liang Jing, et al. Measurement and research of control network's accuracy of CSNS linear accelerator[J]. Bulletin of Surveying and Mapping, 2016(1): 104-107 [15] 郭迎钢, 李宗春, 刘忠贺, 等. 加速器隧道控制网变形可监测性及稳定性分析[J]. 原子能科学技术, 2019, 53(9):1634-1642Guo Yinggang, Li Zongchun, Liu Zhonghe, et al. Deformation detectability and stability analysis for tunnel control network of particle accelerator[J]. Atomic Energy Science and Technology, 2019, 53(9): 1634-1642 [16] 于成浩, 柯明, 赵振堂. 提高激光跟踪仪测量精度的措施[J]. 测绘科学, 2007, 32(2):54-56,178Yu Chenghao, Ke Ming, Zhao Zhentang. The accuracy enhancement measures for laser tracker[J]. Science of Surveying and Mapping, 2007, 32(2): 54-56,178 -

 点击查看大图
计量
- 文章访问数: 32
- HTML全文浏览量: 23
- PDF下载量: 3
- 被引次数: 0
